

Your one-stop shop for stock research
Closed beta — now testing with a small group; join the waitlist below for launch access
Research stocks like an analyst.
Tenfold Investing packs live quotes, SEC financials, a screener, valuation tools, paper trading and plain-English lessons into one clean studio — built for every level of investor, from beginning investors buying their very first stock to the most advanced.
Educational purpose only — not financial advice
Closed beta — Premium launching soon
Tenfold is in a closed beta while we finish licensing our market data — approved tester accounts get Premium free during the beta. When Premium billing opens at $14.99/month, the plans split like this. Whichever plan fits, the studio is built for every level — start as a beginner and go deeper as you advance:
Free
- Research any stock: price, chart, company profile & key metrics
- Research up to 3 stocks per day
- Previous-close prices
- 10 years of financial statements
- SEC filings (10-K, 10-Q, 20-F)
- 1 watchlist (up to 10 stocks)
- 5 buy & sell price alerts
- 12 saved DCFs, 12 projections & 5 dividend models
- Paper trading with $100,000 virtual cash
- Earnings contests — call beat or miss and earn points
- Community sentiment votes, shared projections & most popular stocks
- Run the stock screener
- 12 stock charts — the market heatmap, free cash flow, margins, dividend growth & more
- Share any chart, model or result as a branded screenshot — free on every plan
- The full Learn library — always free
Premium
- Research any stock: price, chart, company profile & key metrics
- Research an unlimited amount of stocks per day
- Current prices — refreshed every 20 minutes
- 10 years of financial statements — annual & quarterly
- An AI summary for every filing in the SEC library (10-K, 10-Q, 20-F)
- Unlimited watchlists
- Unlimited buy & sell price alerts
- Unlimited saved DCFs, projections & dividend plans — incl. Advanced mode
- Paper trading with $100,000 virtual cash
- Earnings contests — call beat or miss and earn points
- Community sentiment votes, shared projections & most popular stocks
- Full screener with saved screens
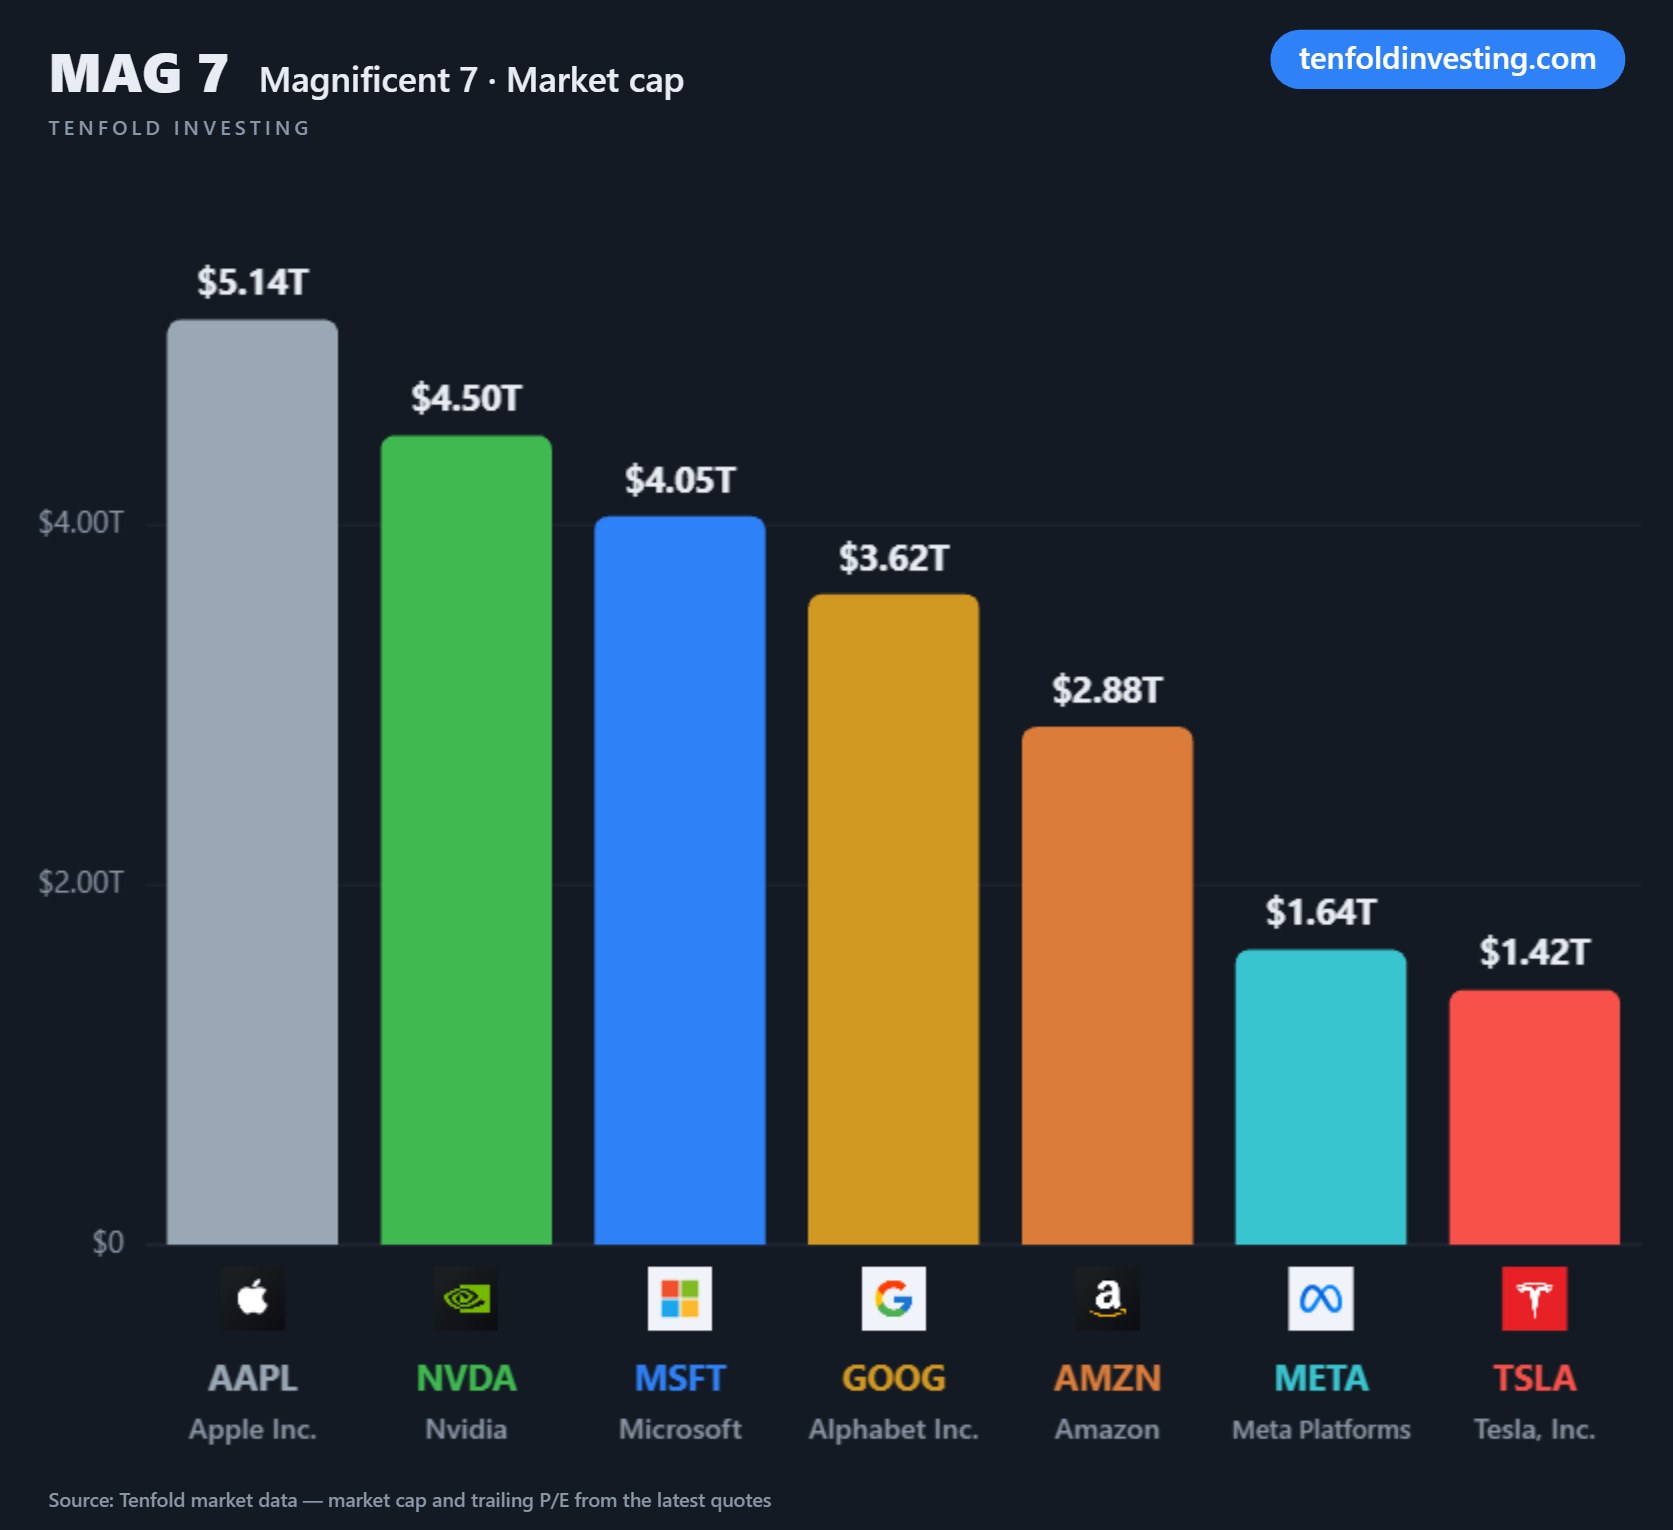
- All 23 stock charts — the 12 free charts plus 11 advanced charts (P/E band, drawdowns, Head to head, Magnificent 7 & more) — plus the Fear & Greed gauge
- Share any chart, model or result as a branded screenshot — free on every plan
- The full Learn library — always free
- Live day moves & live day P/L on your stocks
- Track your own holdings across multiple portfolios, with deposit tracking
- AI SWOT analysis & valuation snapshot on every stock
- Insider trading, research checklist & sector discovery
- Daily brief & full notifications — the day's news and big-swing alerts for your stocks, plus stock notes synced across devices
Join the waitlist
Tenfold is in a closed beta while we finish licensing our market data. Join the Premium waitlist, or sign up to be emailed the moment the free version launches. Premium is $14.99/month at launch. No card required.
You're on the Premium waitlist — we'll email you when Tenfold opens.
You're signed up — we'll email you the moment the free version launches.
Founding members lock in $14.99/mo. No card required to join the waitlist, and nothing is charged until billing opens. Educational content only — not financial advice.
Live quotes & screener
Quotes across 2,700+ stocks and a screener that scans them in seconds.
SEC financials & filings
Income, balance sheet and cash-flow statements plus 10-K/10-Q filings, straight from SEC EDGAR.
Investing tools & DCF
Compound-interest, DCF, projection-playground and dividend calculators that show every step of the math.
Watchlists, alerts & notifications
Follow the stocks you care about, set buy-price alerts, and get pinged on big moves, earnings, model target hits and new 52-week highs and lows.
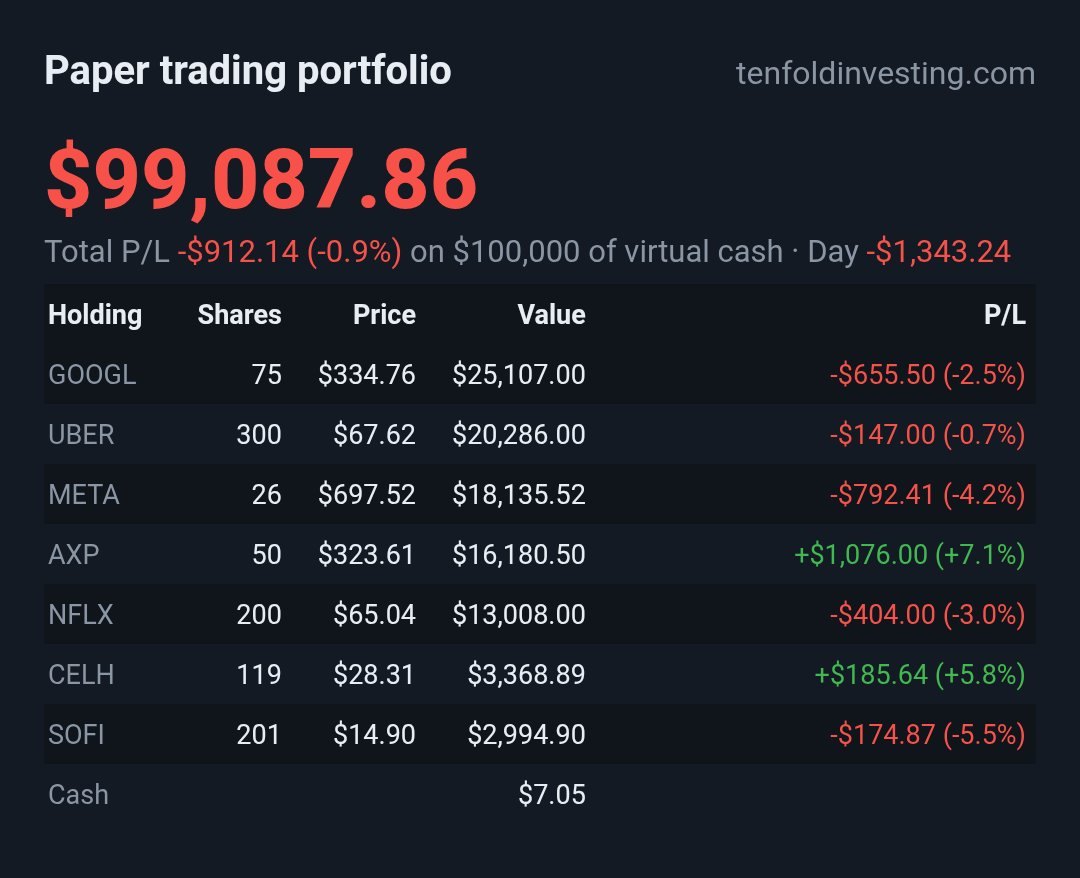
Paper trading portfolio
$100,000 of virtual cash, diversification checkups and sector discovery.
Track your own holdings
Add the stocks you actually own — you enter them yourself, Tenfold never logs into your broker — and track performance, day P/L, deposits and allocation at a glance. (Premium)
Community contests
Vote sentiment, share price guesses, call earnings beats and browse the most-watched stocks — virtual points, just for fun.
Plain-English AI insights
Bull/bear cases, moats and key risks, refreshed monthly. No jargon.
Learn investing, free
Plain-English lessons and a glossary that explains every number on the site — always free.
Stock research
Every stock, researched like an analyst
Open any of 2,700+ stocks and ETFs and the whole story is on one page — price, story, numbers and what to watch, with a plain-English explainer on every metric.
- Quotes refreshed about every 20 minutes, with interactive charts from one day to the full price history
- Key metrics up front — P/E, margins, growth, dividend, valuation — and a More metrics panel down to short interest from FINRA: shares short, short float and days to cover
- Analyst consensus and the next earnings report's EPS and revenue estimates
- Why it's moving — the day's catalyst in plain English, plus similar companies to compare against
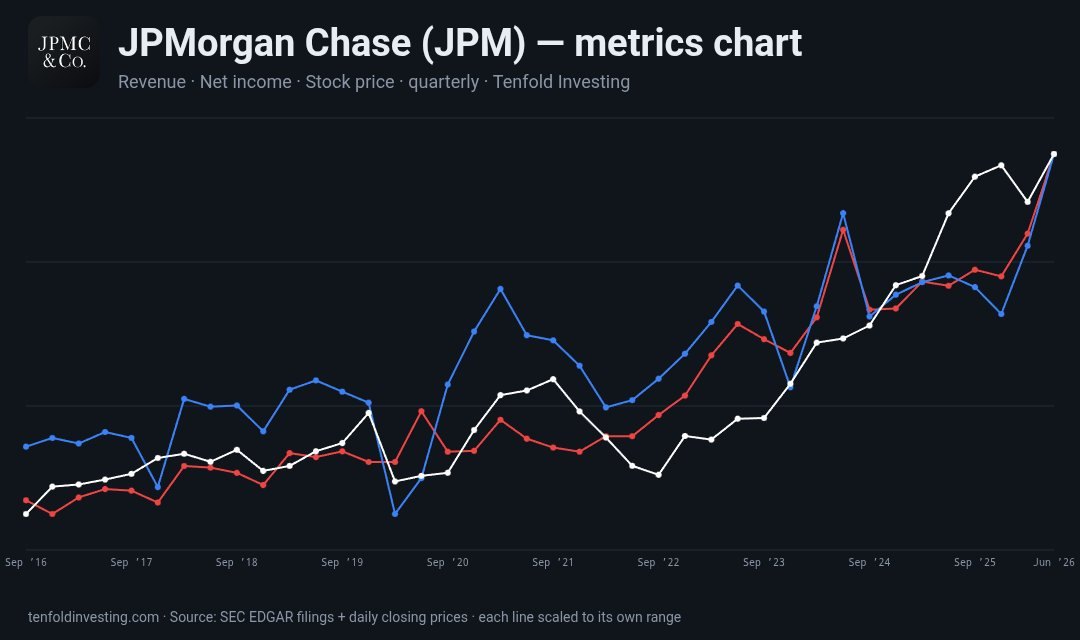
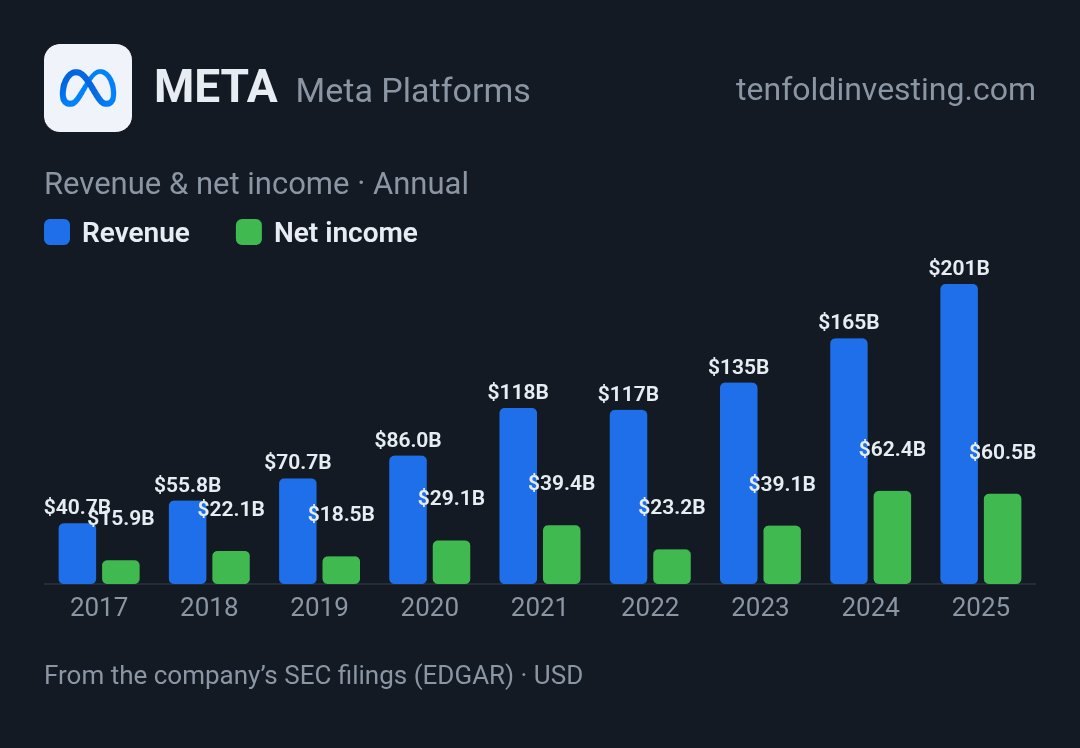
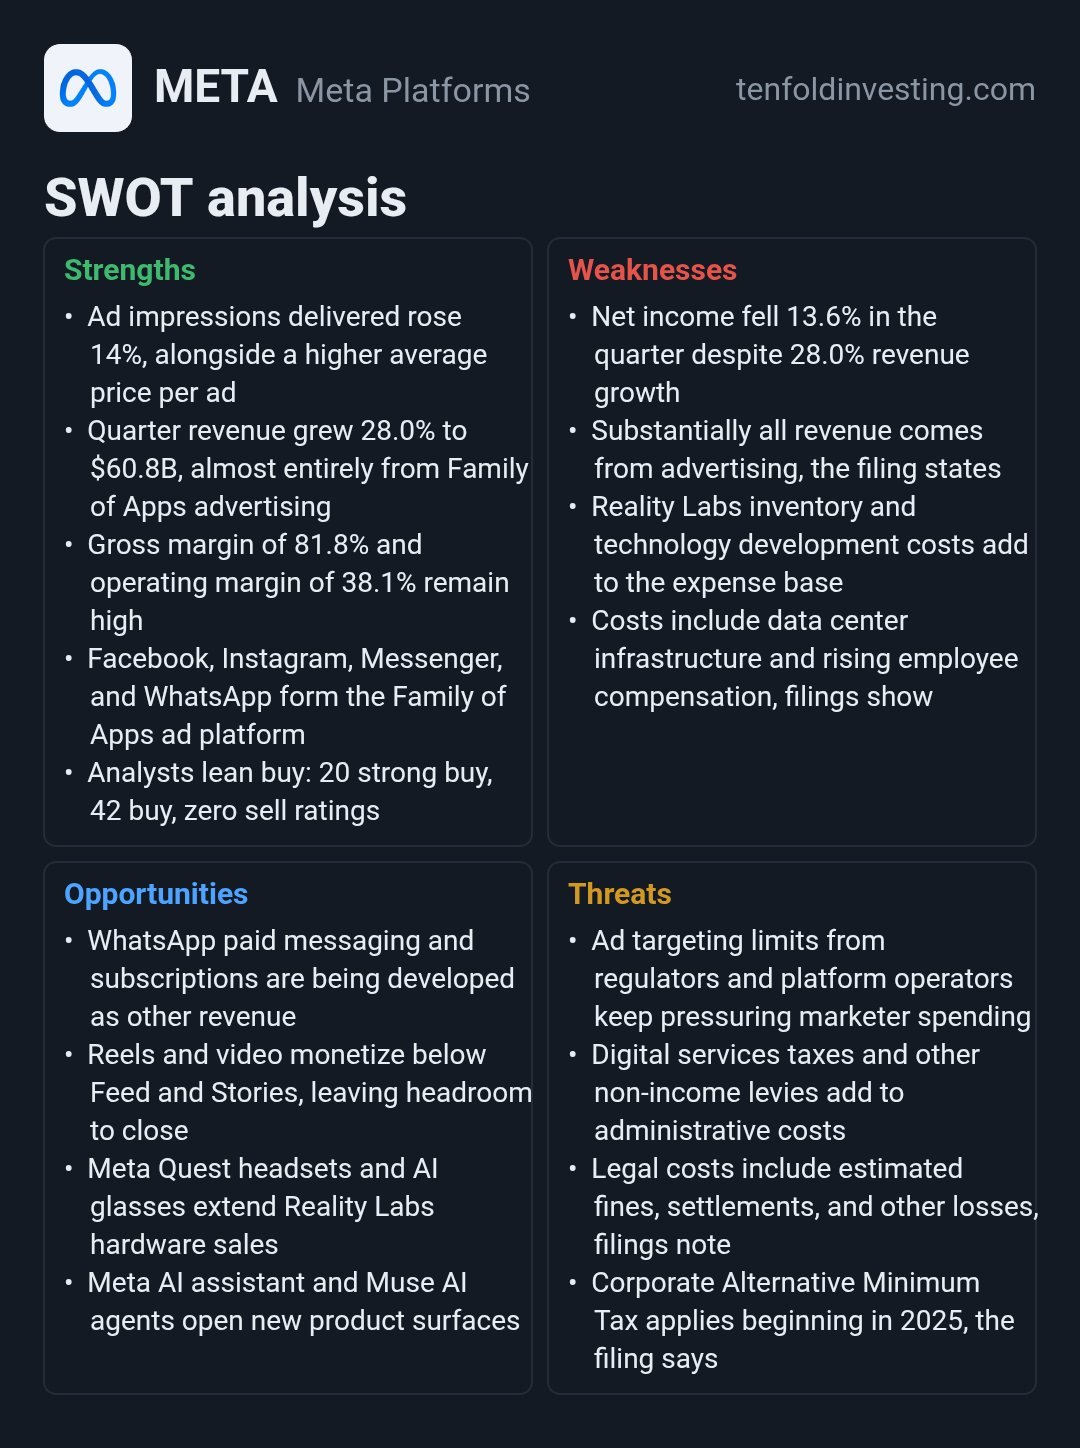
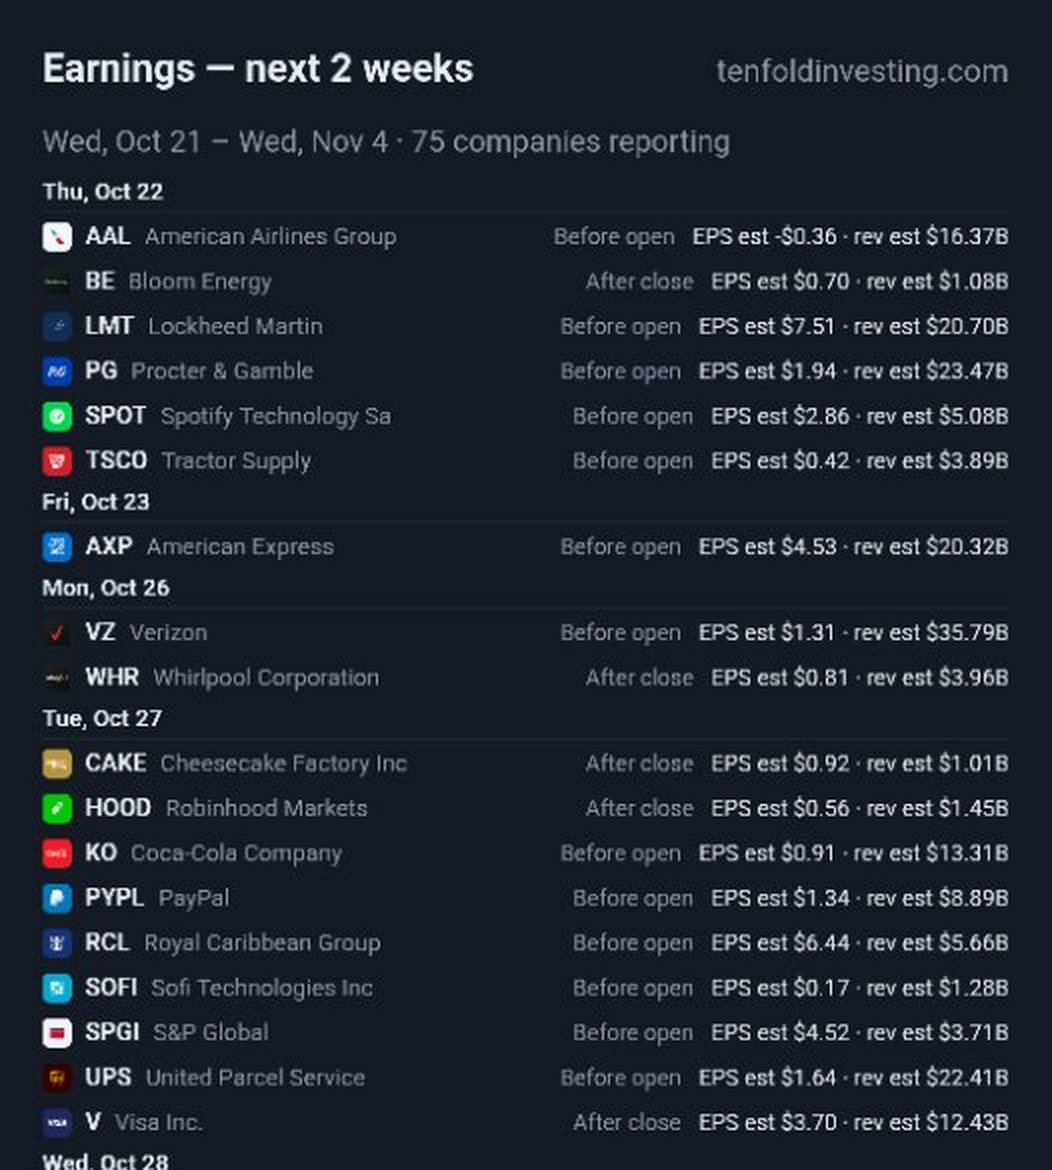
Financials & SEC filings
Ten years of financials, straight from the SEC
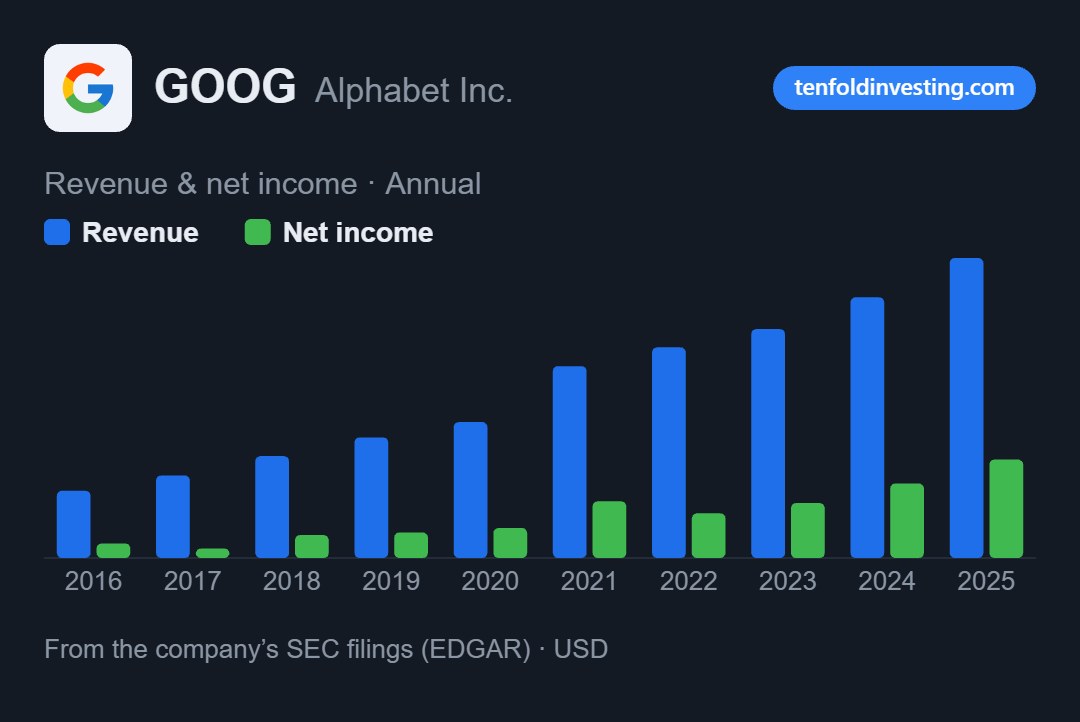
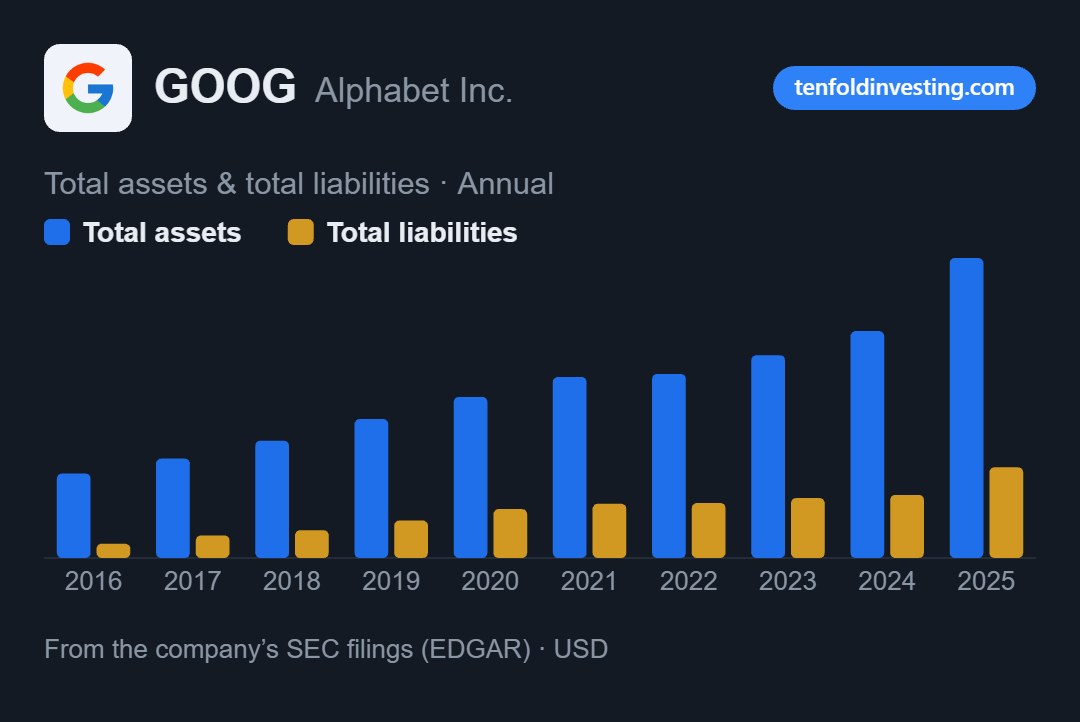
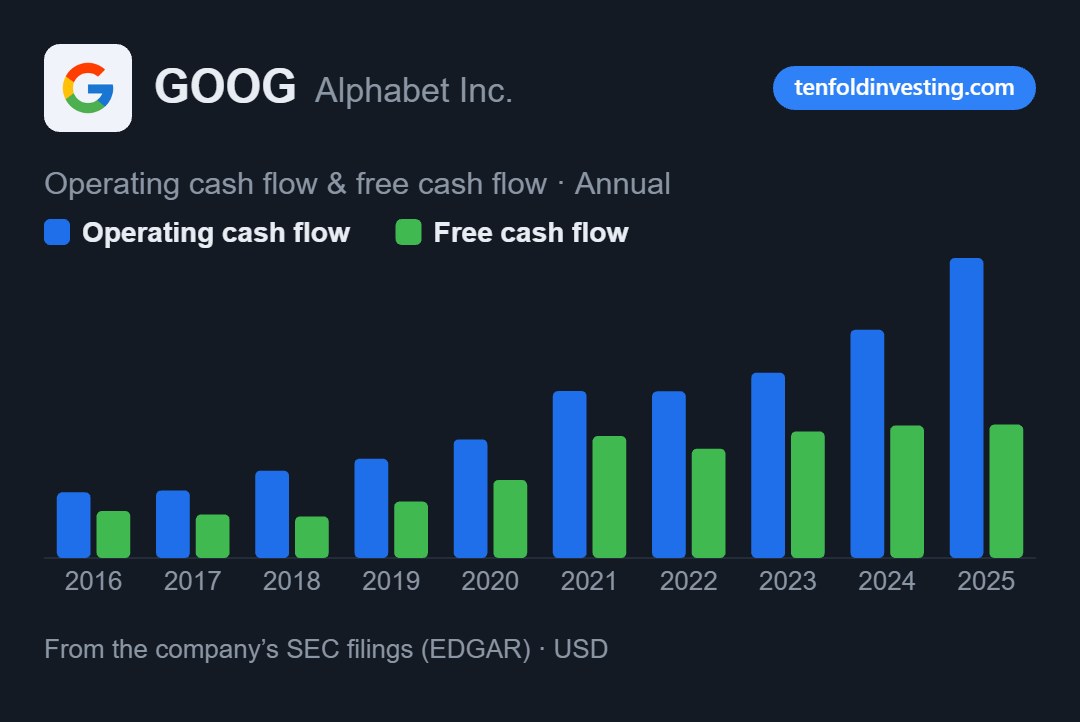
No scraped summaries — the statements come from the company's own SEC EDGAR filings, annual and quarterly, with charts that make the trend obvious.
- 10 years of annual statements plus up to 40 quarters — income statement, balance sheet and cash flow
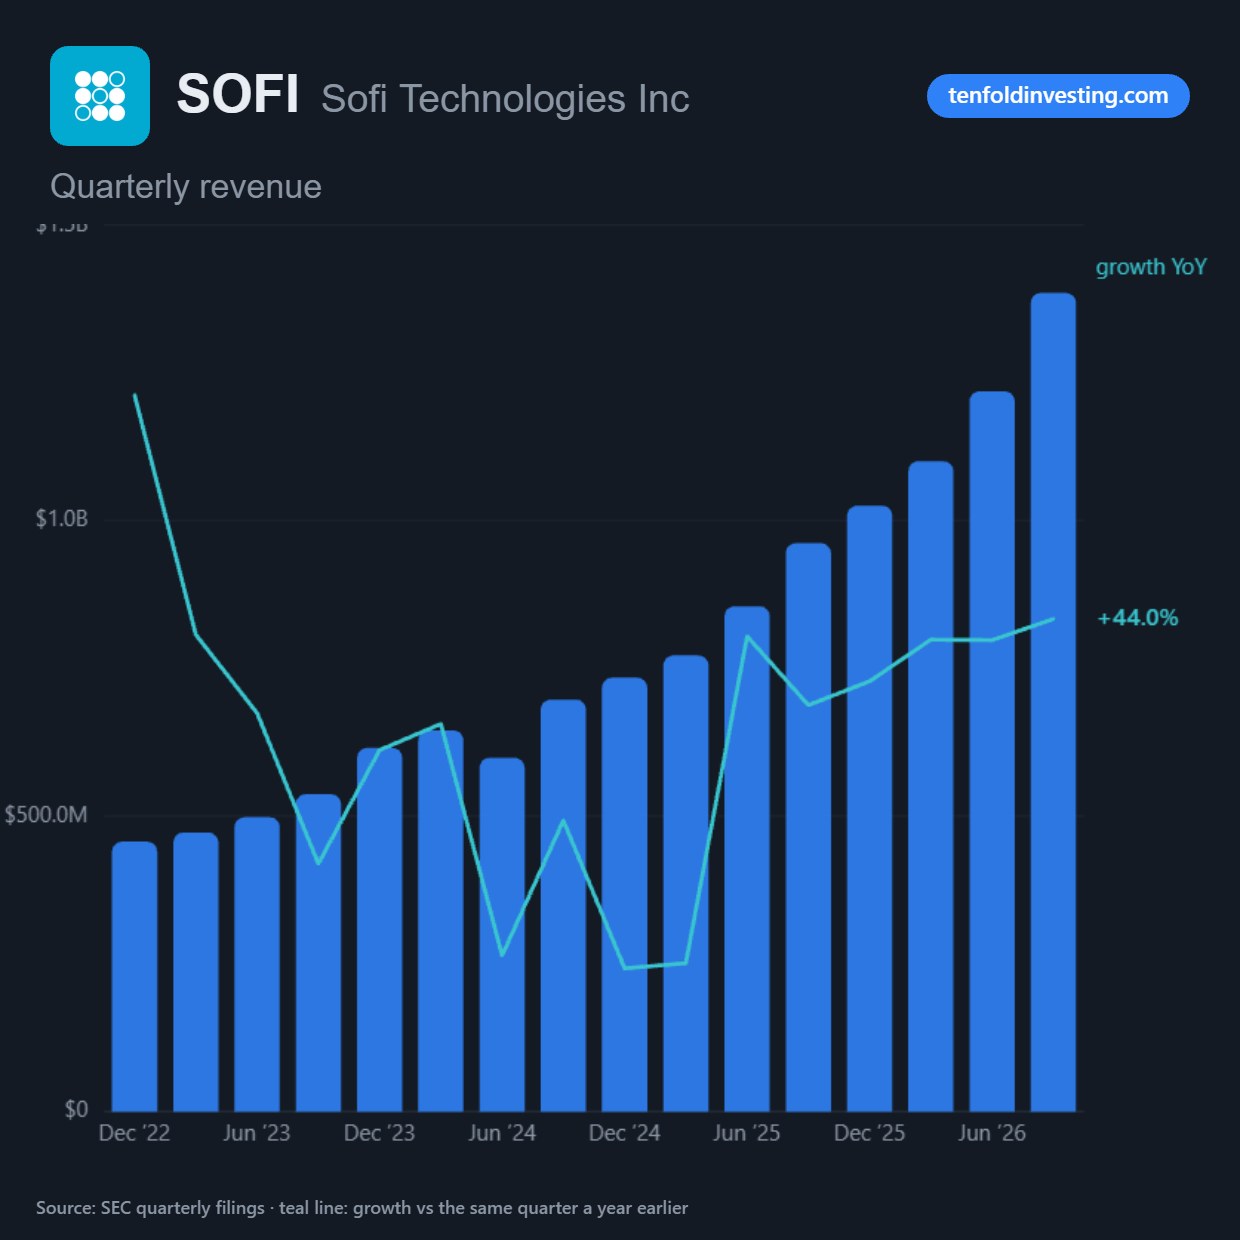
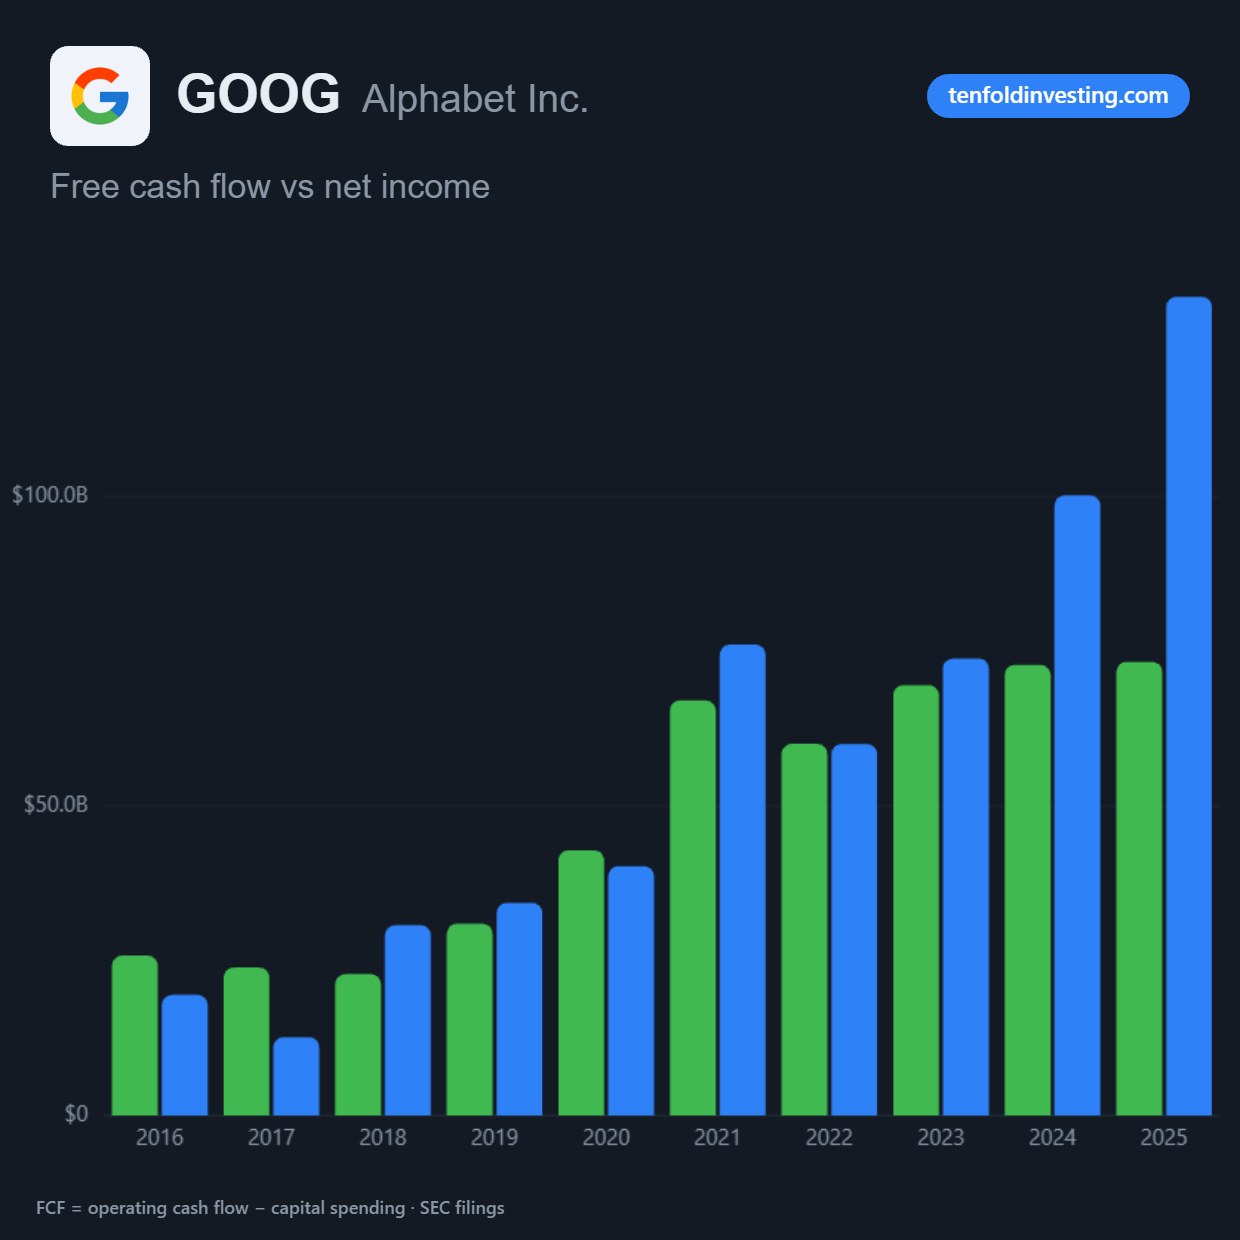
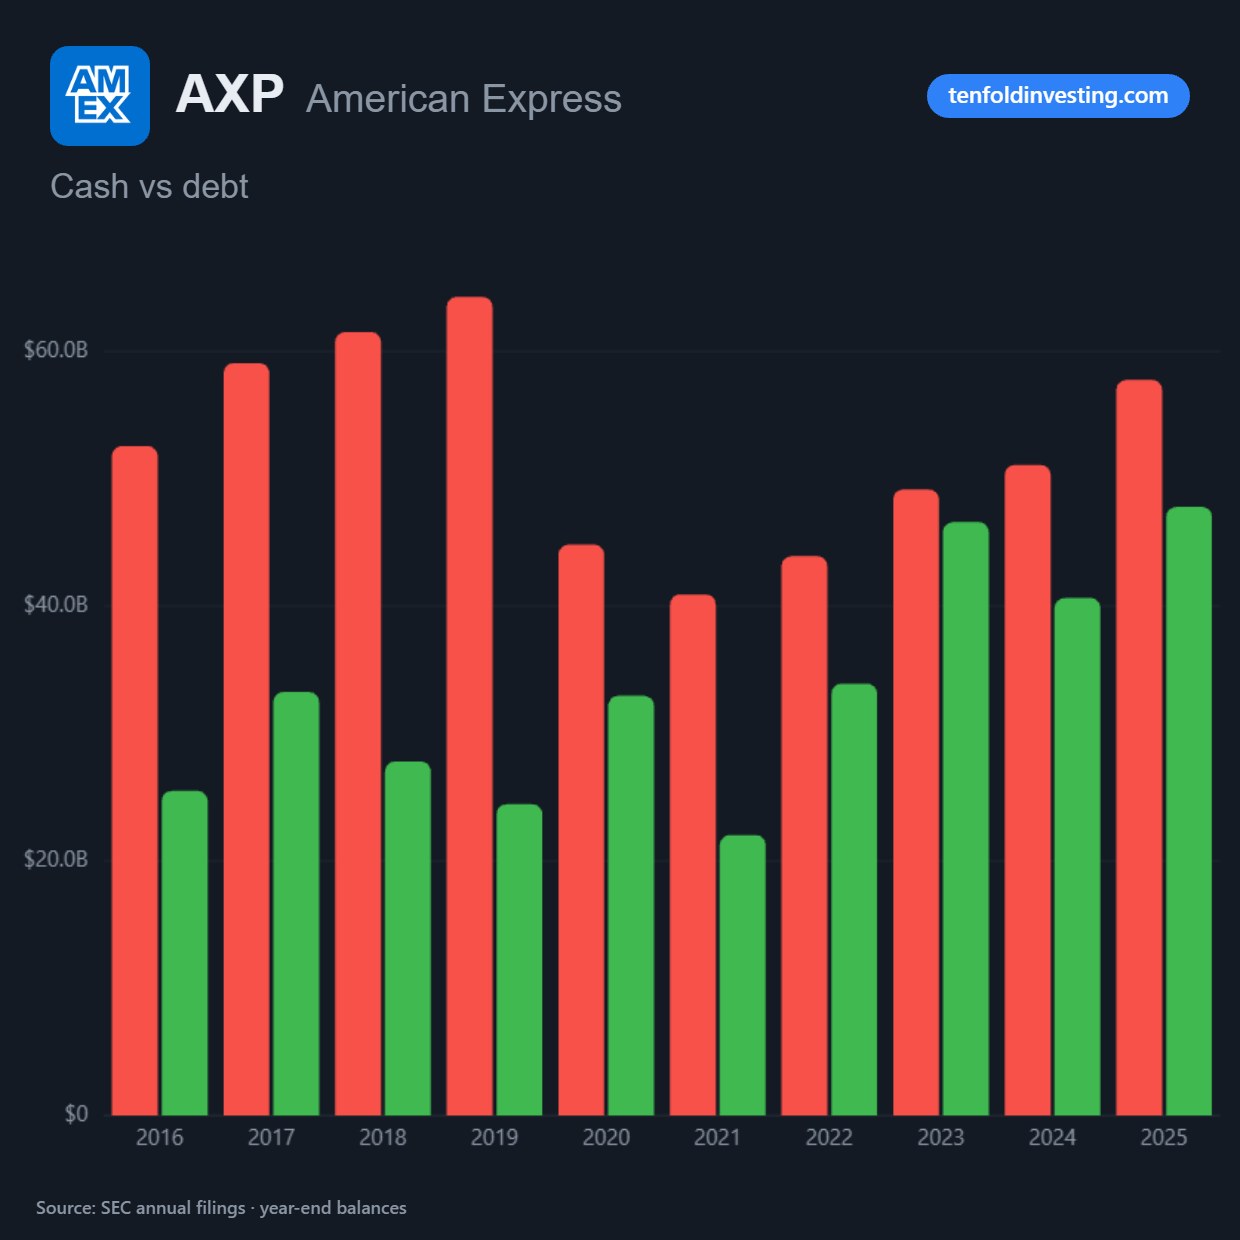
- Grouped bar charts for every section, including revenue, margins, free cash flow and dividends per share
- Every company's most recent 10-K, 10-Q and 20-F filings, with an AI summary of each and per-filing summaries that say what changed
- Growth rows on every line, year over year and quarter over quarter
AI insights
AI that reads the filings for you
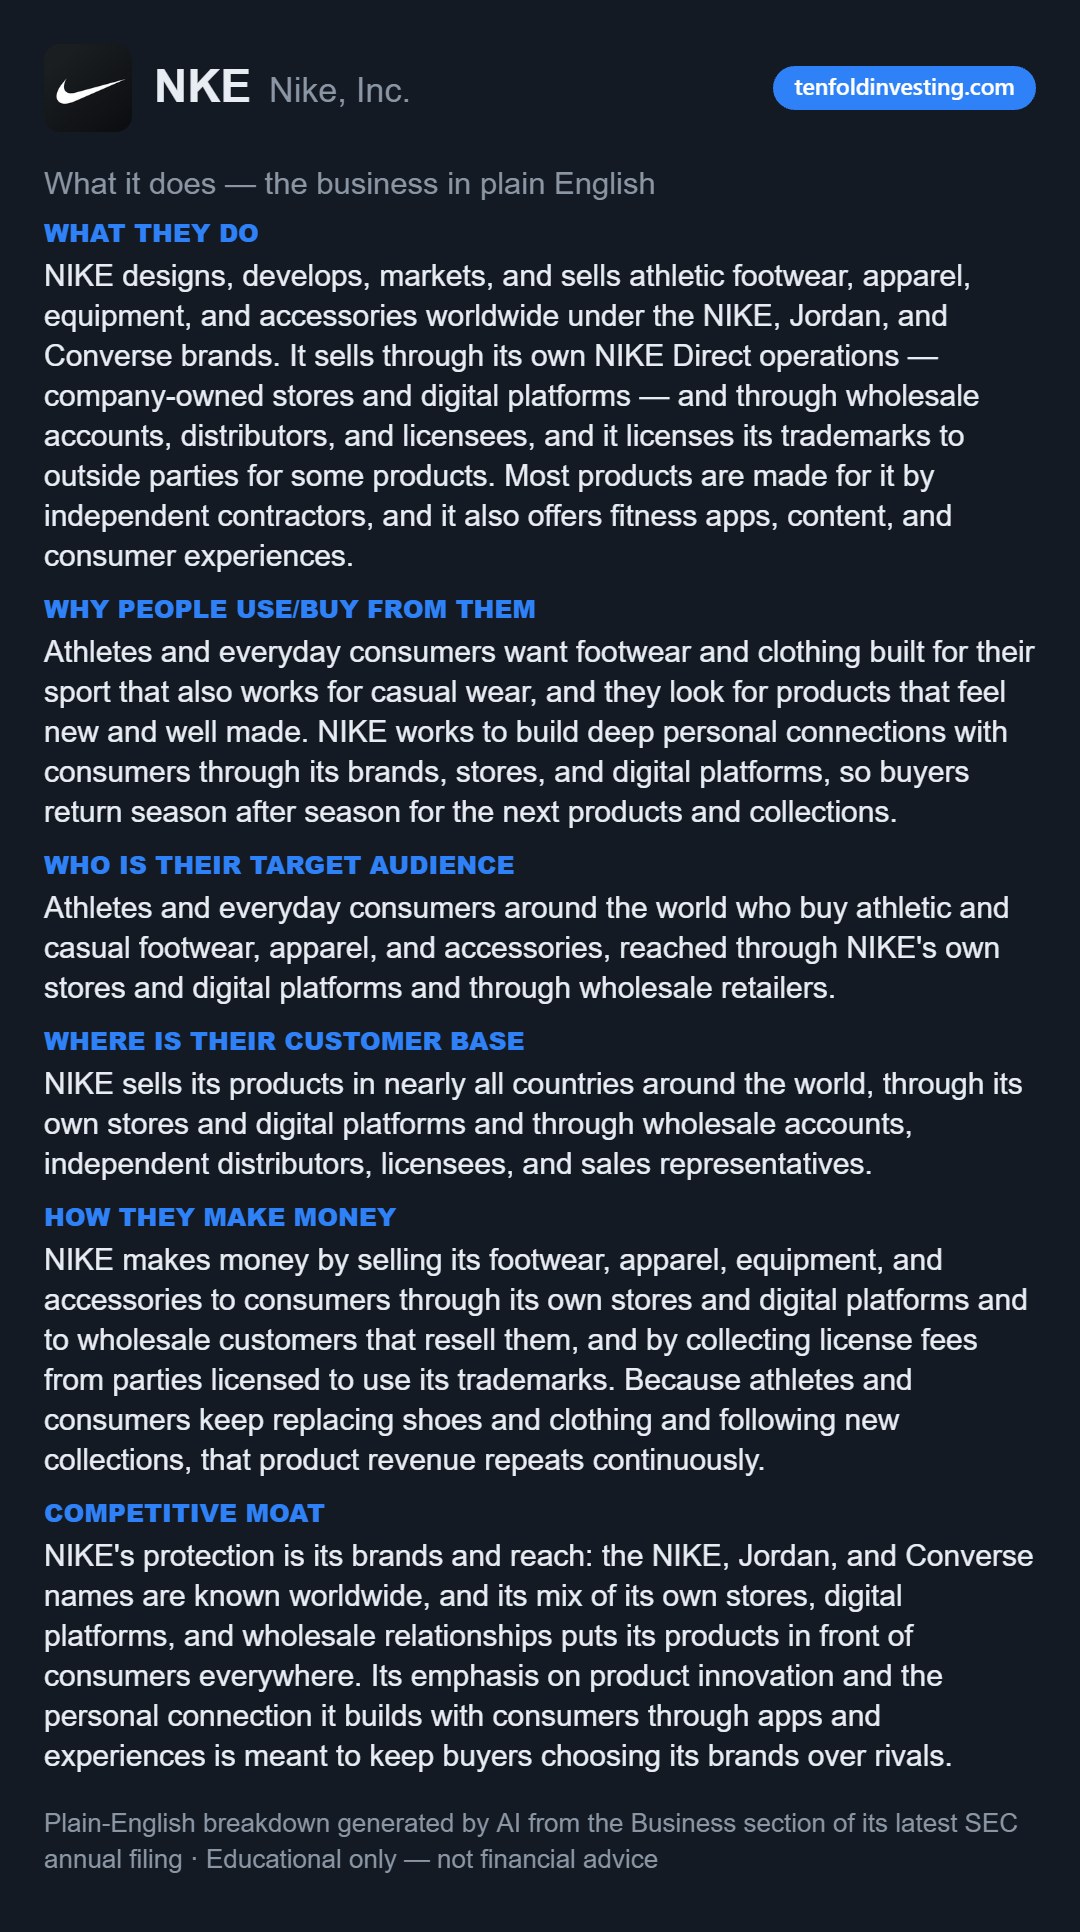
Every stock carries an AI SWOT drawn from its latest SEC filing — detailed strengths, weaknesses, opportunities and threats, refreshed as new filings land.
- Strengths, weaknesses, opportunities and threats for all 2,700+ stocks
- A valuation snapshot on every stock — possibly undervalued or overvalued, and why
- Bull and bear cases, moats and key risks in plain English — no jargon
Valuation tools
Value a stock with your own assumptions
The same models the pros use, with every step of the math shown — change an assumption and see exactly what it does to the answer.
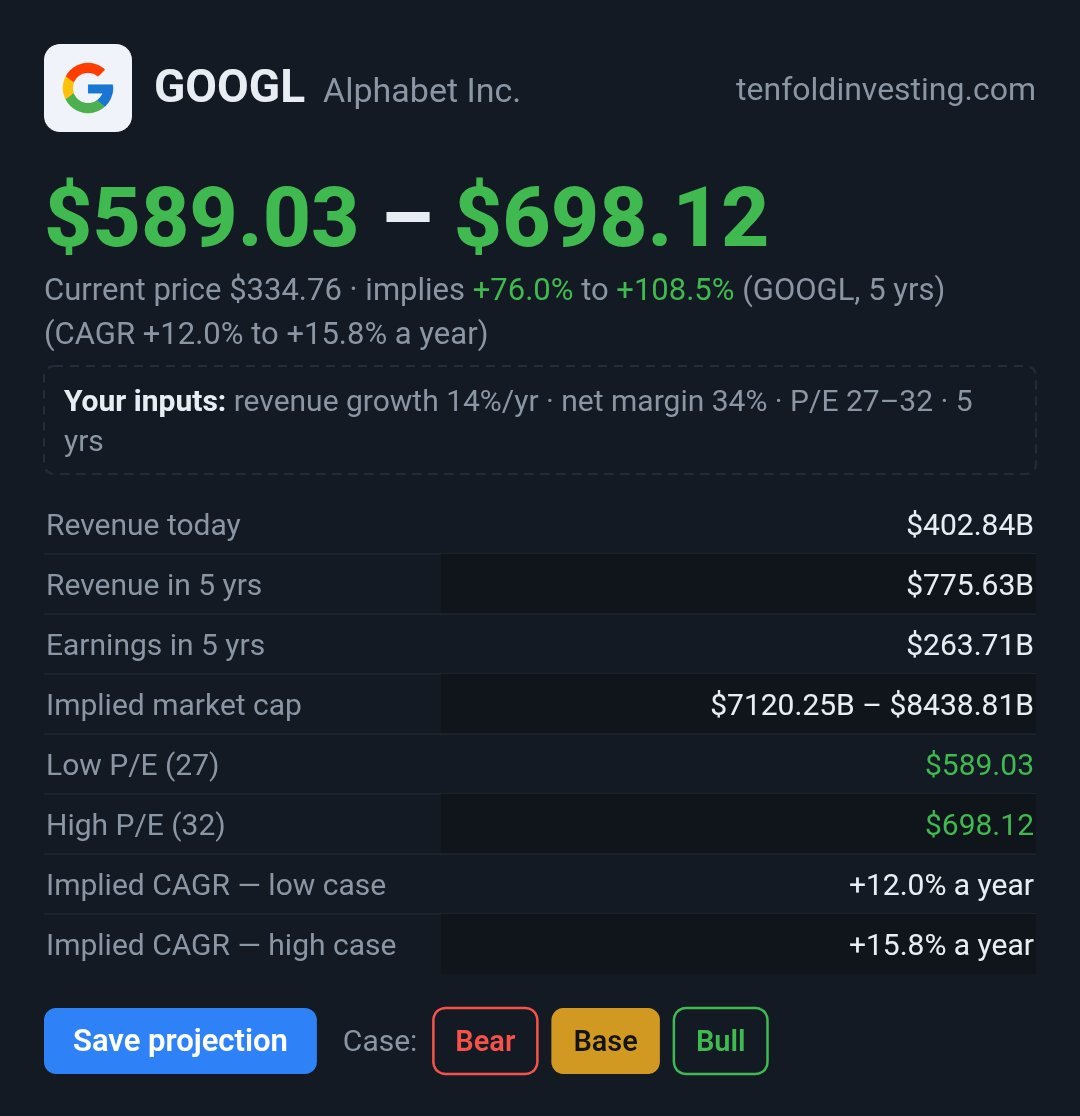
- Projection Playground — your growth, margin and P/E assumptions in, an implied future price and yearly return out, with Bull, Base and Bear cases and an Advanced per-year mode
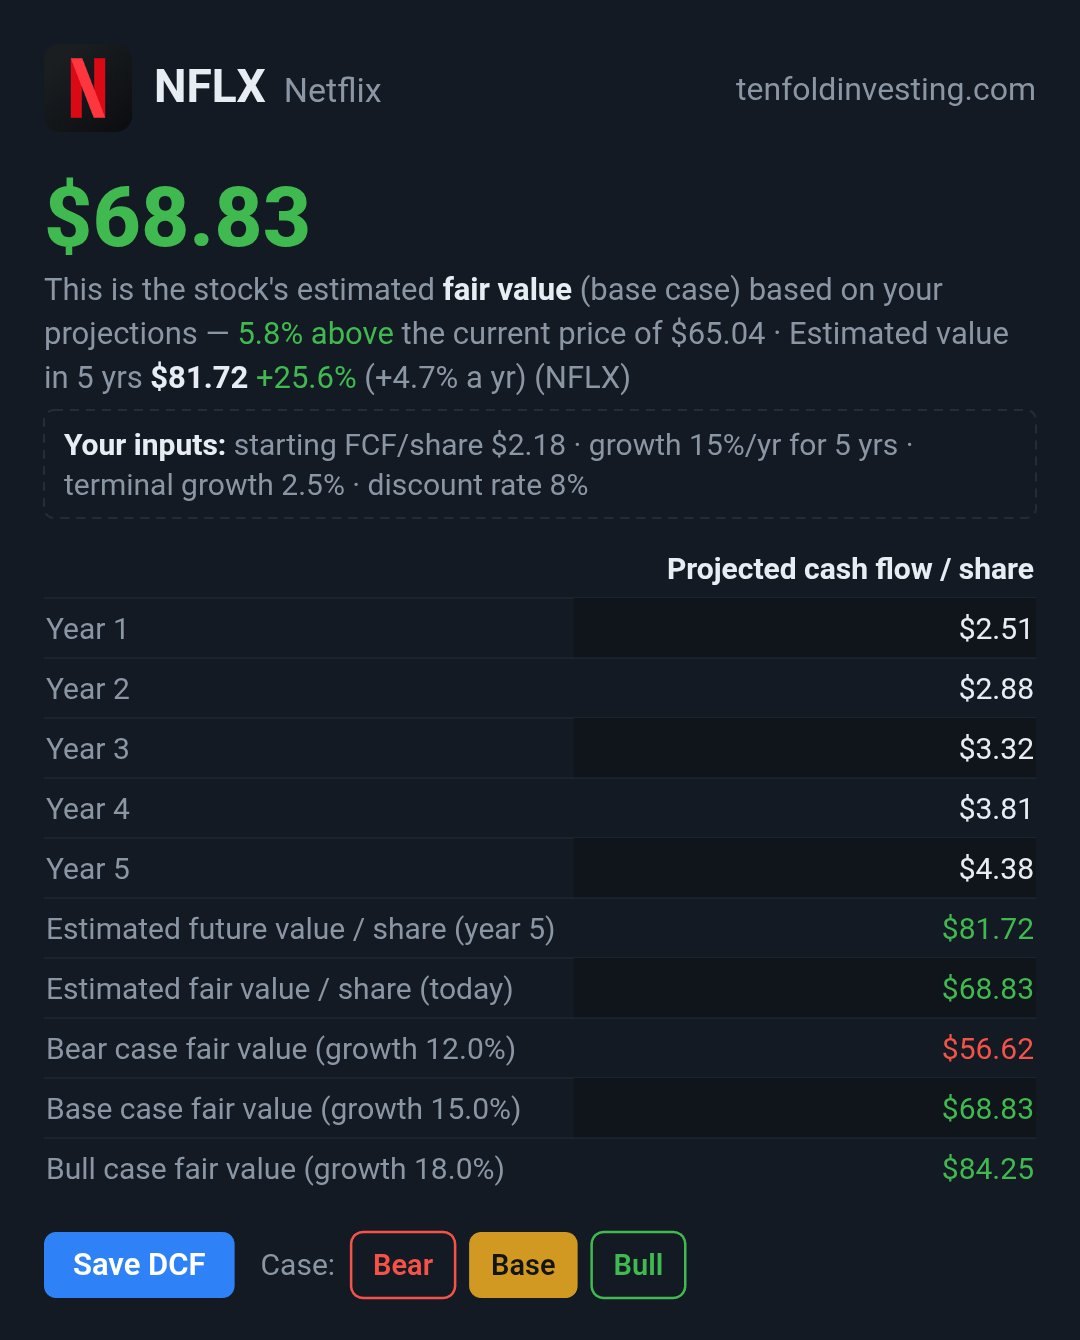
- DCF model — fair value from future cash flows, bear / base / bull side by side
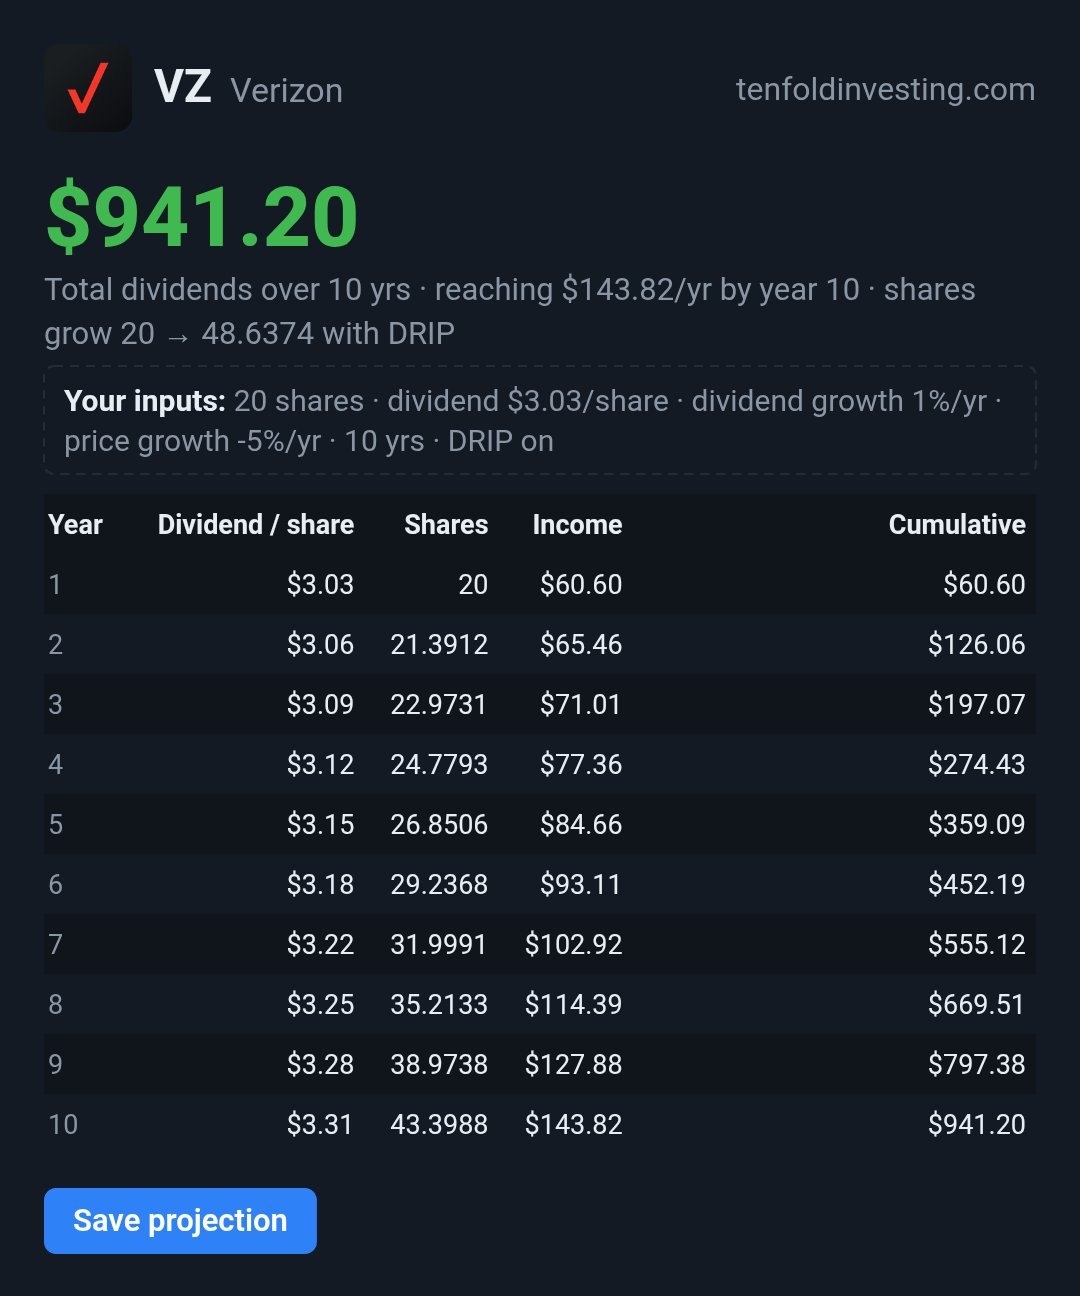
- Dividend projection model with reinvestment (DRIP), plus a compound-interest calculator
- Save unlimited models and see them ranked by base-case yearly return or DCF upside
Watchlists, alerts & portfolios
Track what you own — and what you're watching
Follow the stocks you care about and let Tenfold watch them for you: prices, earnings, big moves and the targets in your own models.
- Multiple watchlists — import yours from your old app or brokerage by CSV, or just paste the tickers
- Buy-price and sell-price alerts that fire when your price is reached
- A notifications bell for big swings (with the reason why), earnings as they land, new 52-week highs and lows, and model target hits
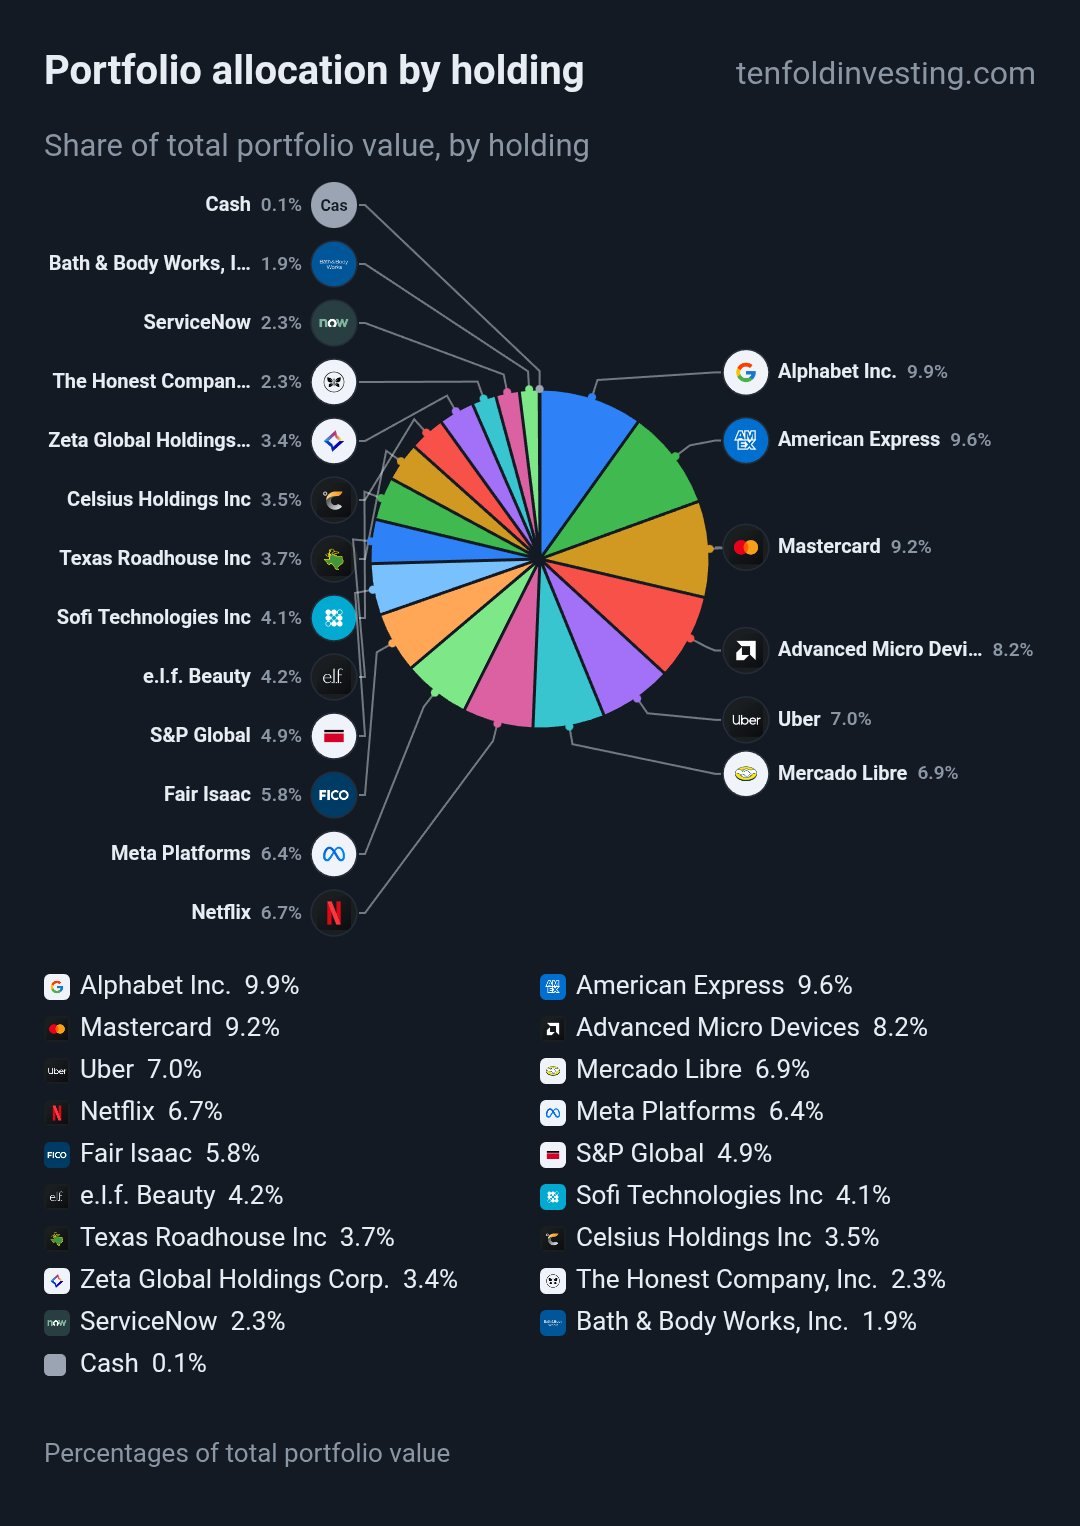
- Track your own holdings — performance, live day P/L, deposits and allocation across multiple portfolios
- Paper trading with $100,000 of virtual cash, diversification checkups and stock notes that follow your account across devices
Screener & compare
Find your next idea in seconds
The stock screener scans the full 2,700+ stock universe at once, and Compare puts finalists head to head.
- Filter by P/E, dividend yield, market cap, distance from the 52-week high, day move, sector and more — type exact numbers or pick a quick range band
- Save your screens and re-run them anytime
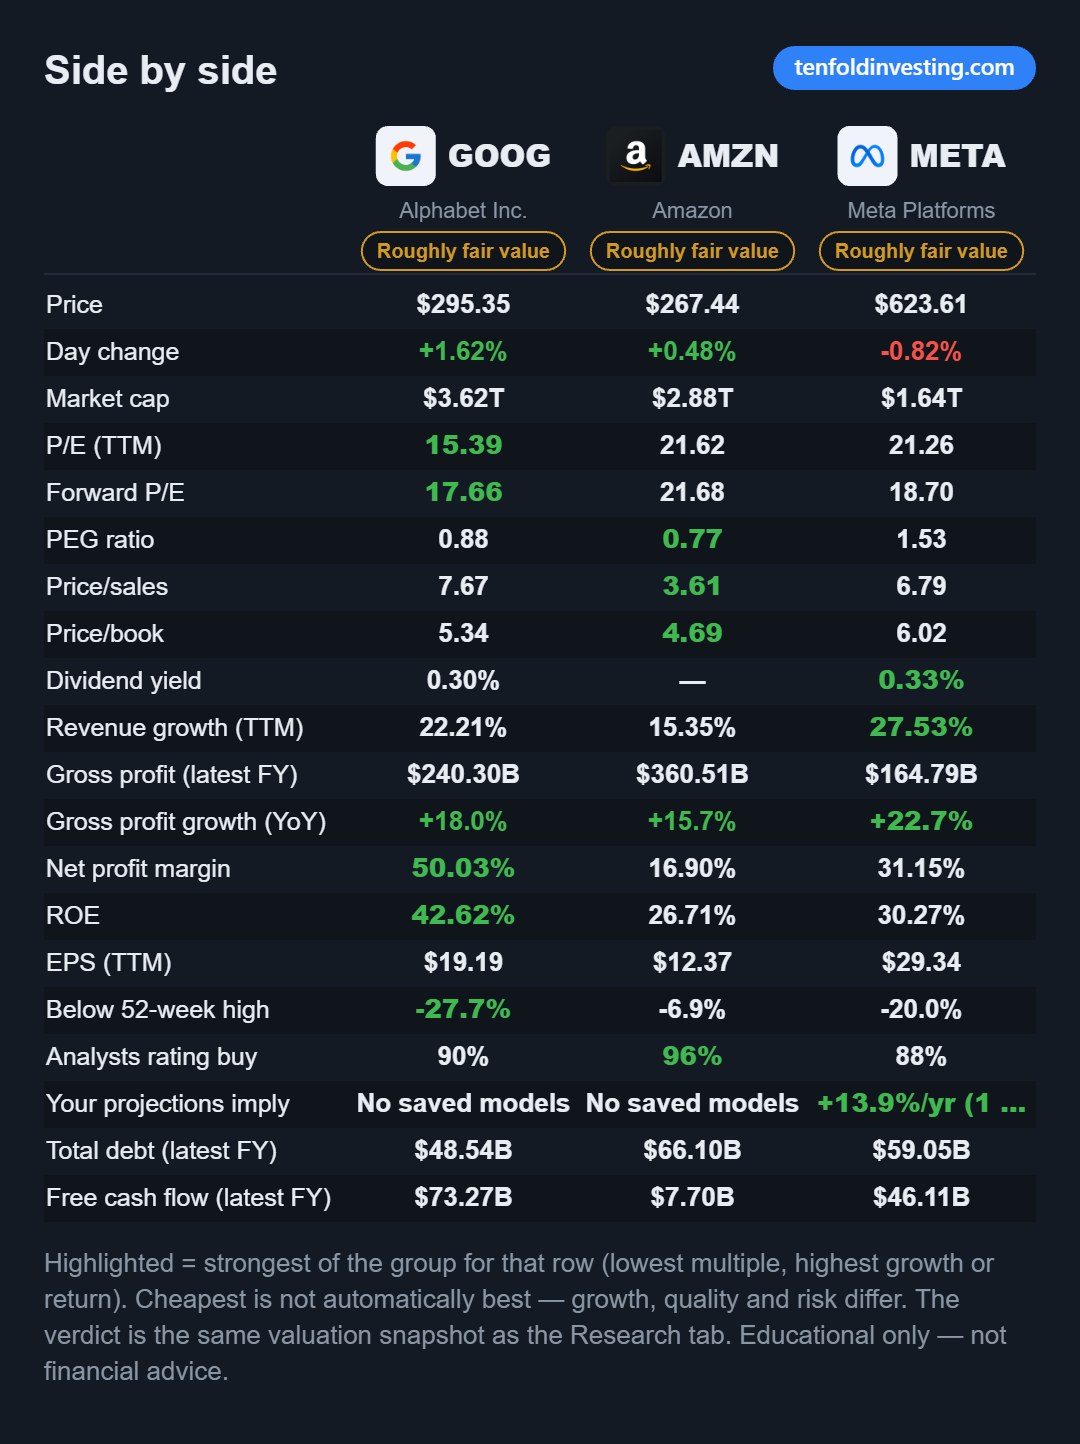
- Compare up to three stocks across about twenty measures, with the strongest in each row highlighted
Contests & community
Learn faster, together
Research is better with a crowd — test your calls against earnings season and see what other members are doing.
- Earnings contests — call beat or miss before a company reports, earn virtual points, climb the leaderboard
- Community sentiment votes and shared projections on every stock
- Most popular stocks this month — what the community is watching and holding
Charts
Every stock, charted sixteen ways
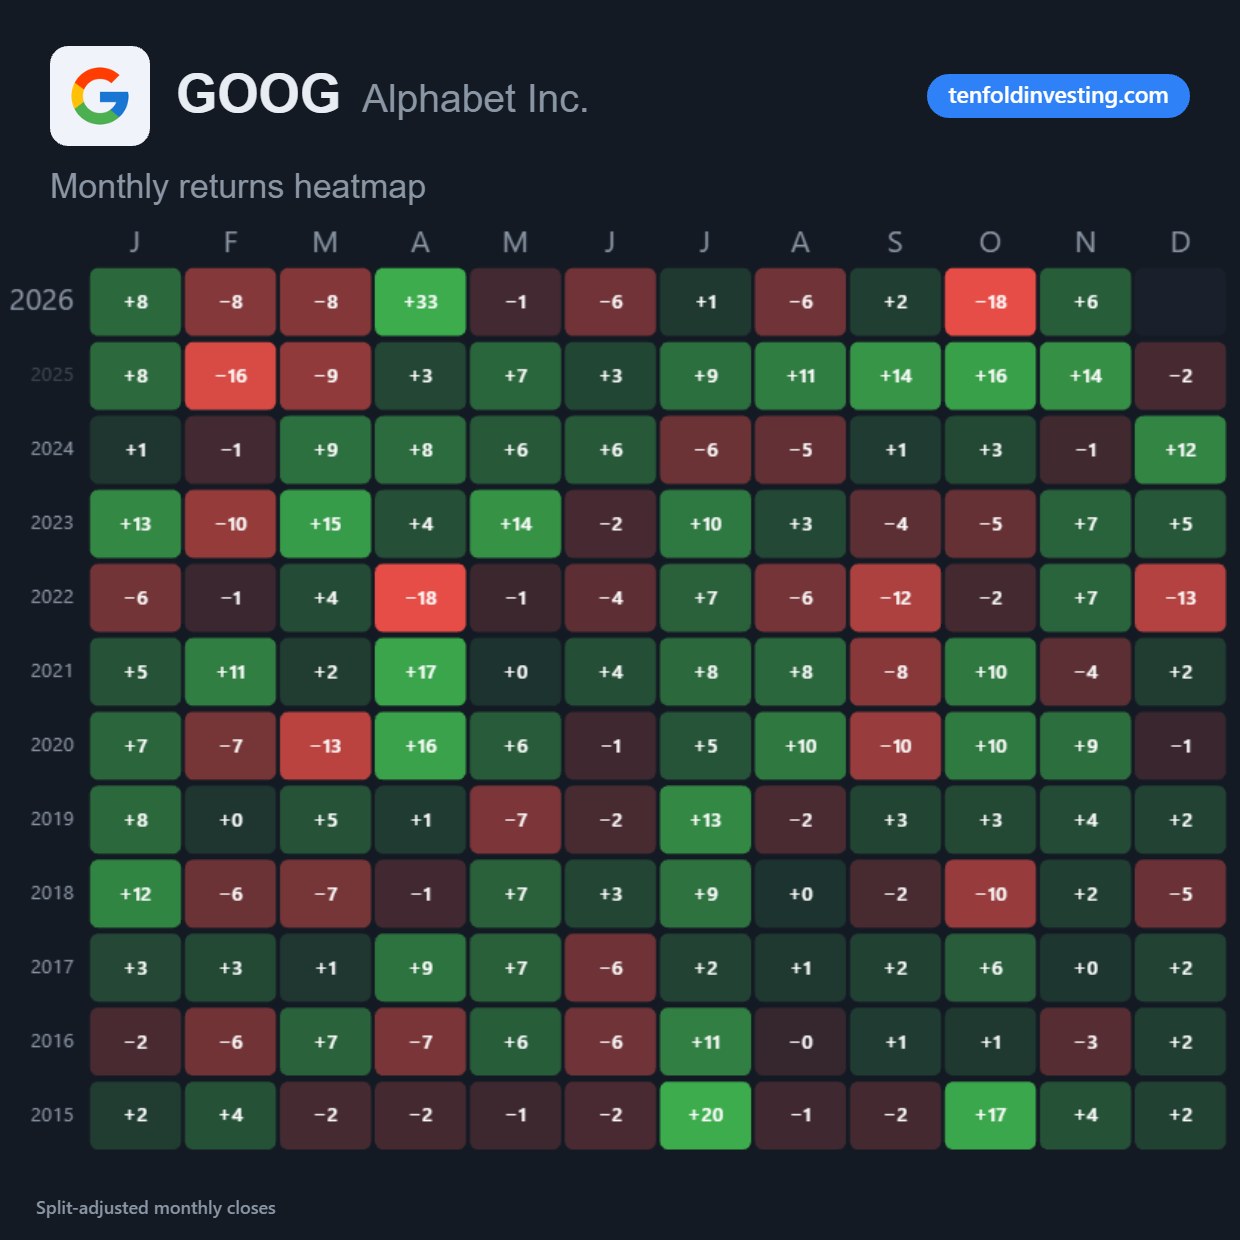
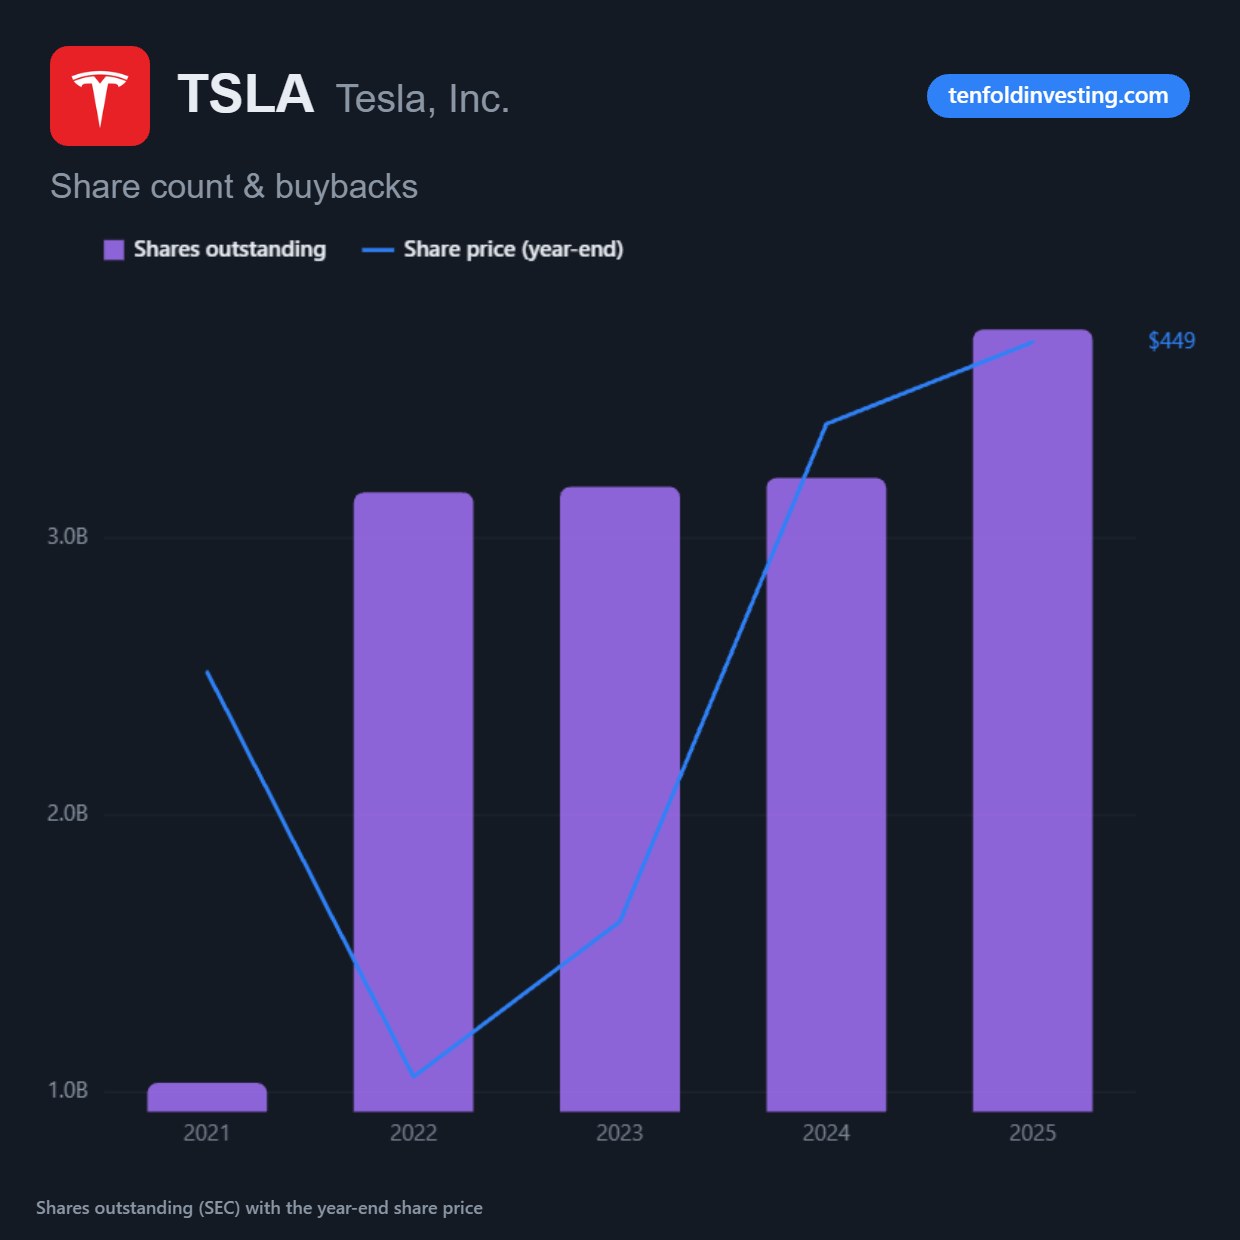
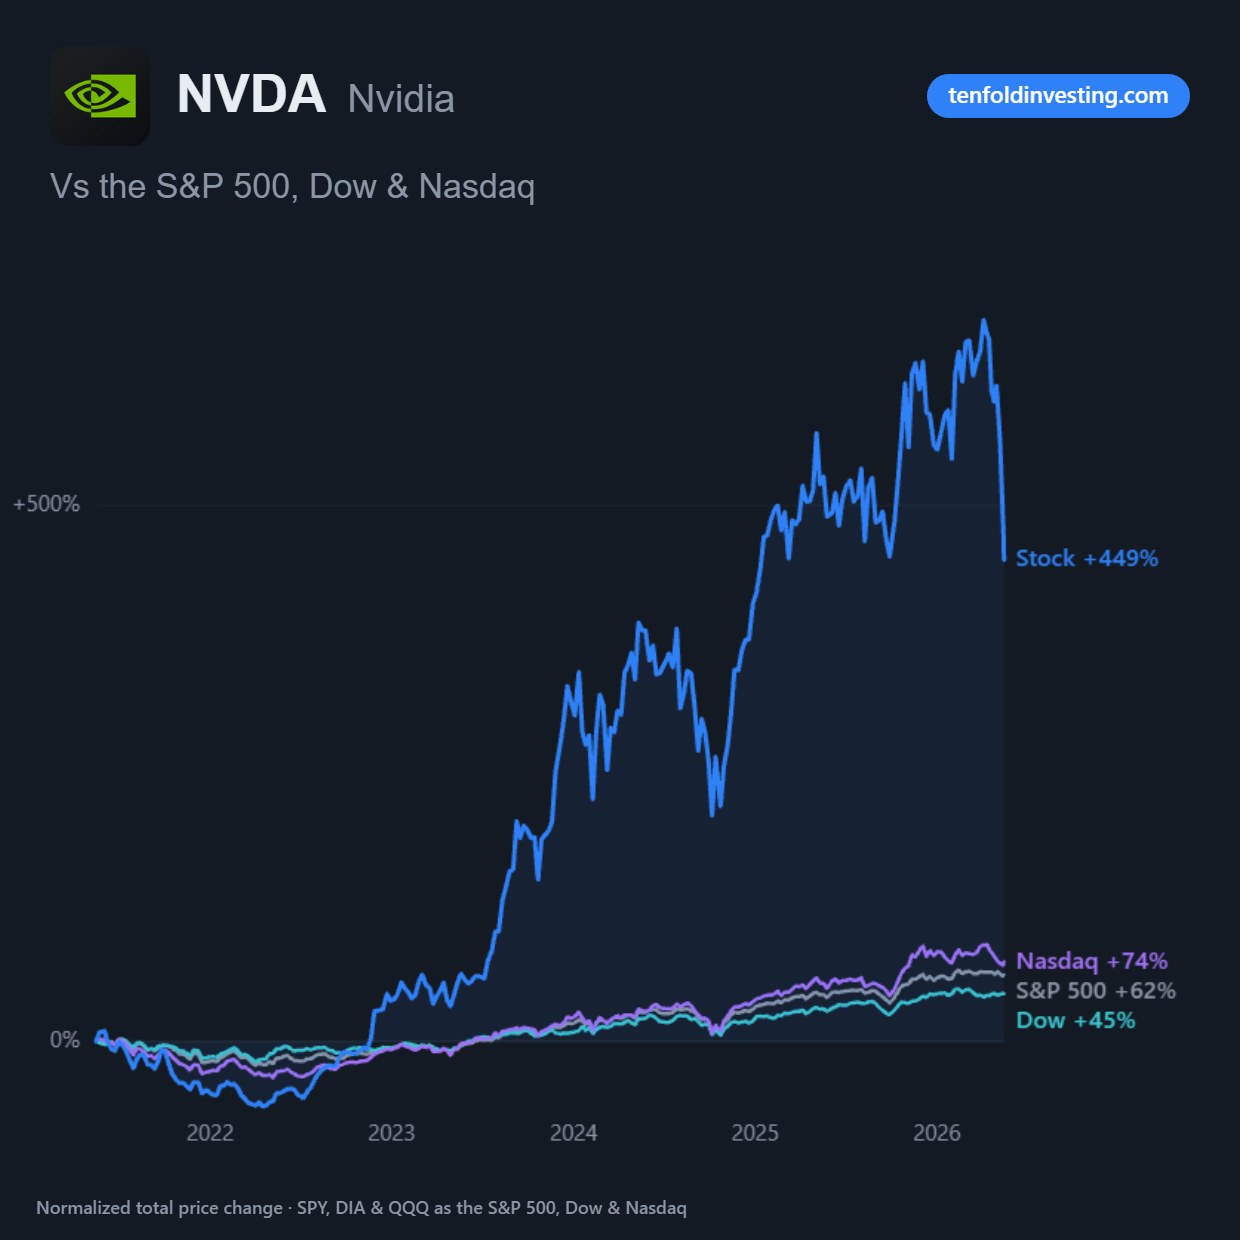
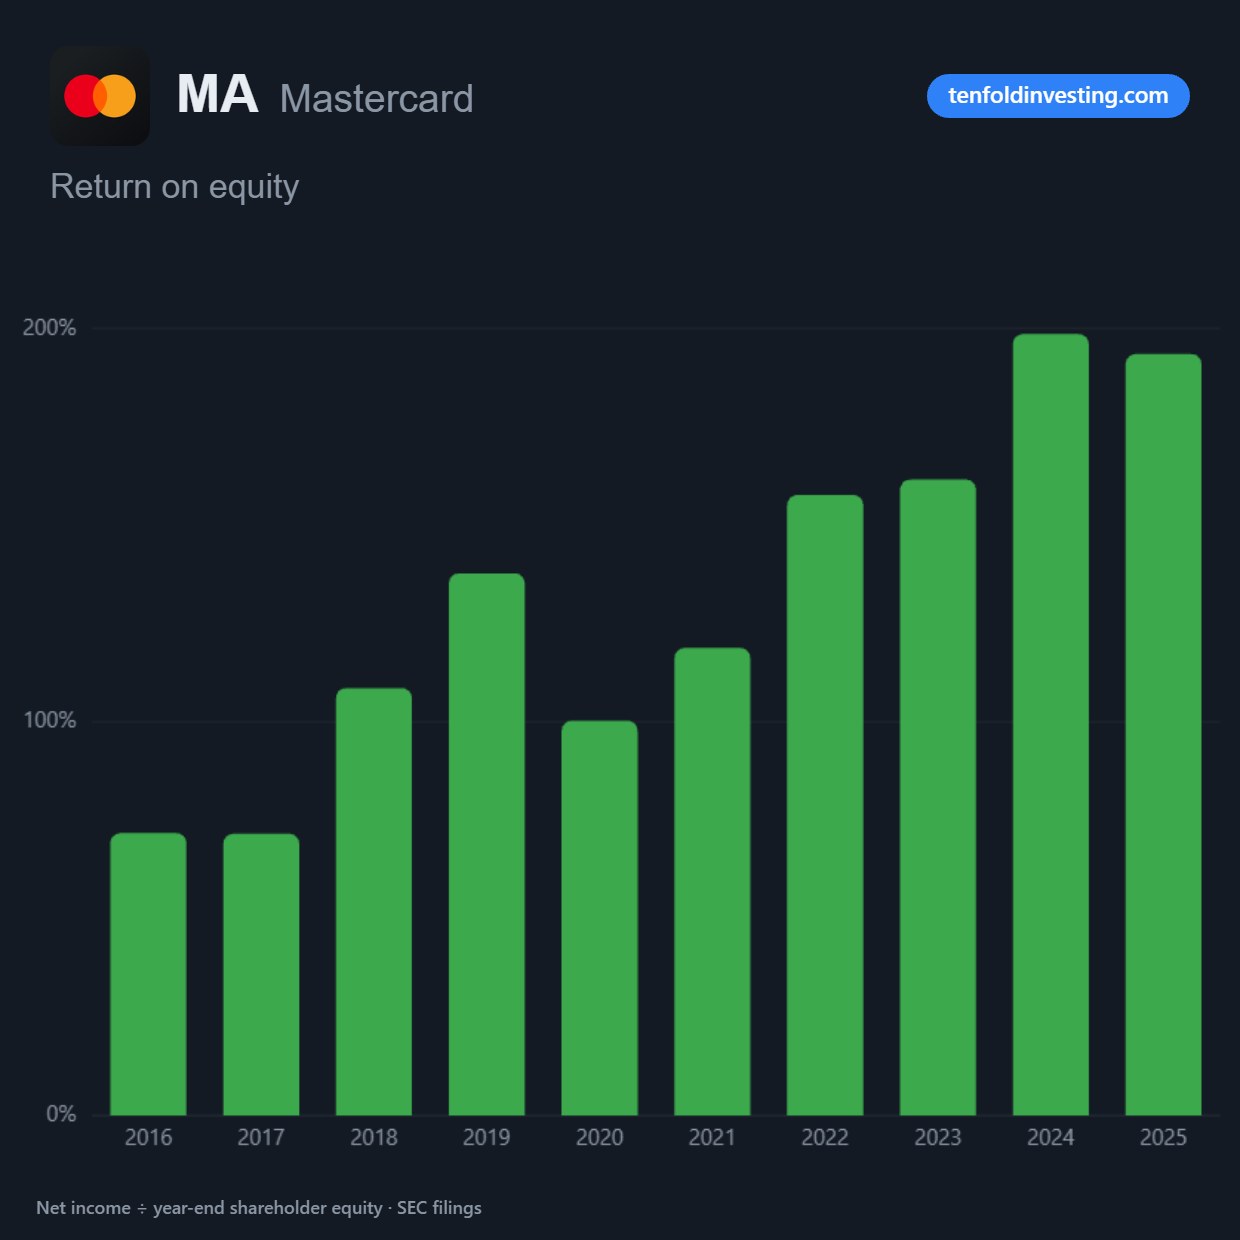
The Charts tab turns raw SEC filings and prices into pictures that answer the questions investors actually ask — is it cheap for itself, when does it tend to move, and where does the money go.
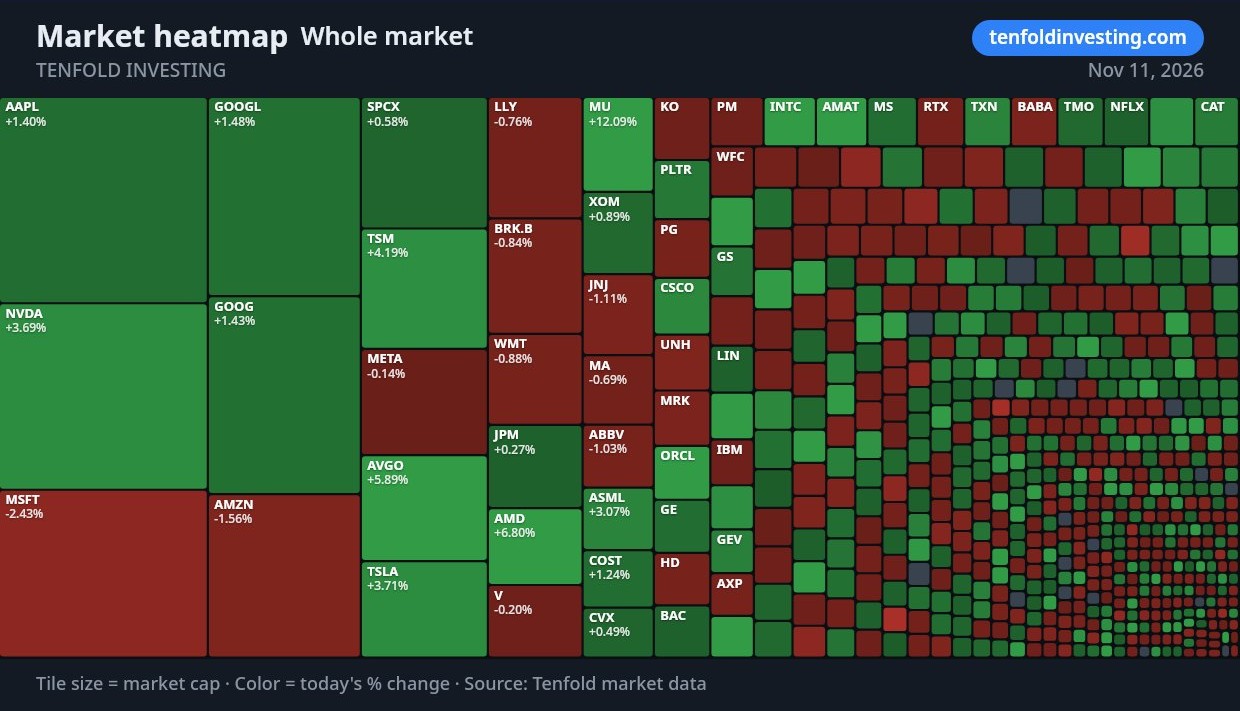
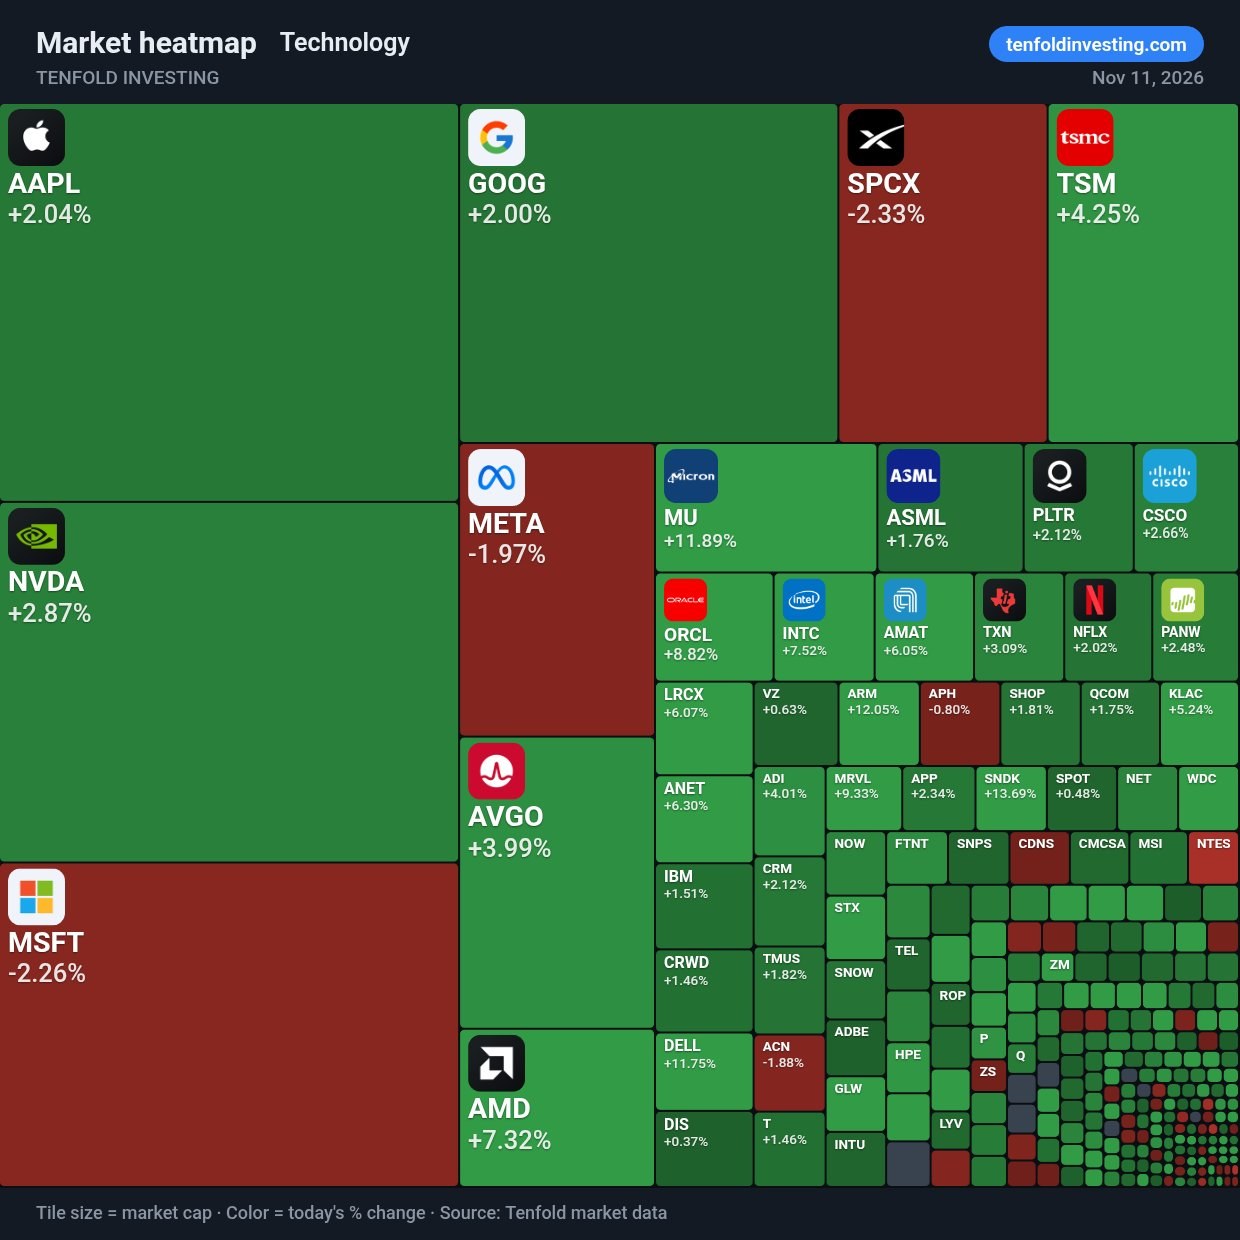
- A live market heatmap — the 600 largest stocks sized by market cap and colored by today's move; tap any tile to open that stock's charts
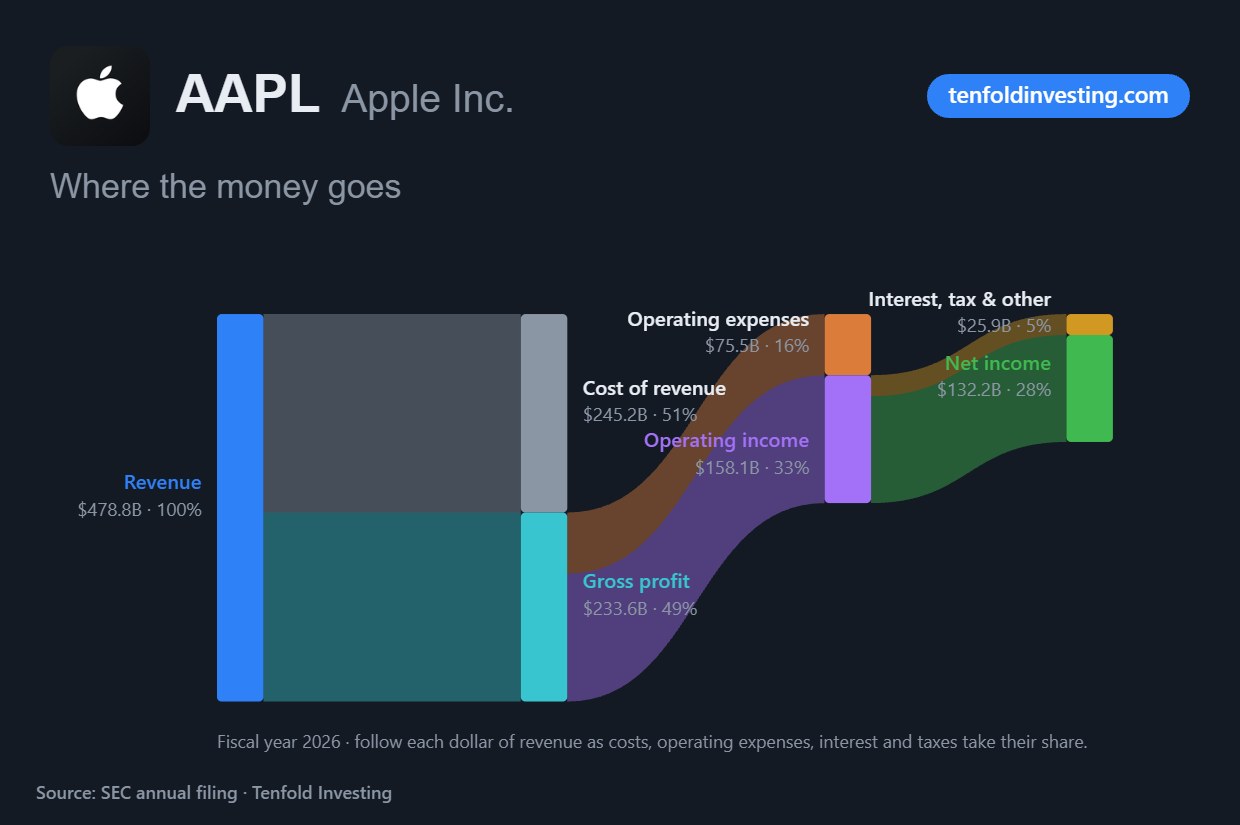
- Revenue-to-net-income flow: follow each dollar of revenue as costs, operating expenses, interest and taxes take their share
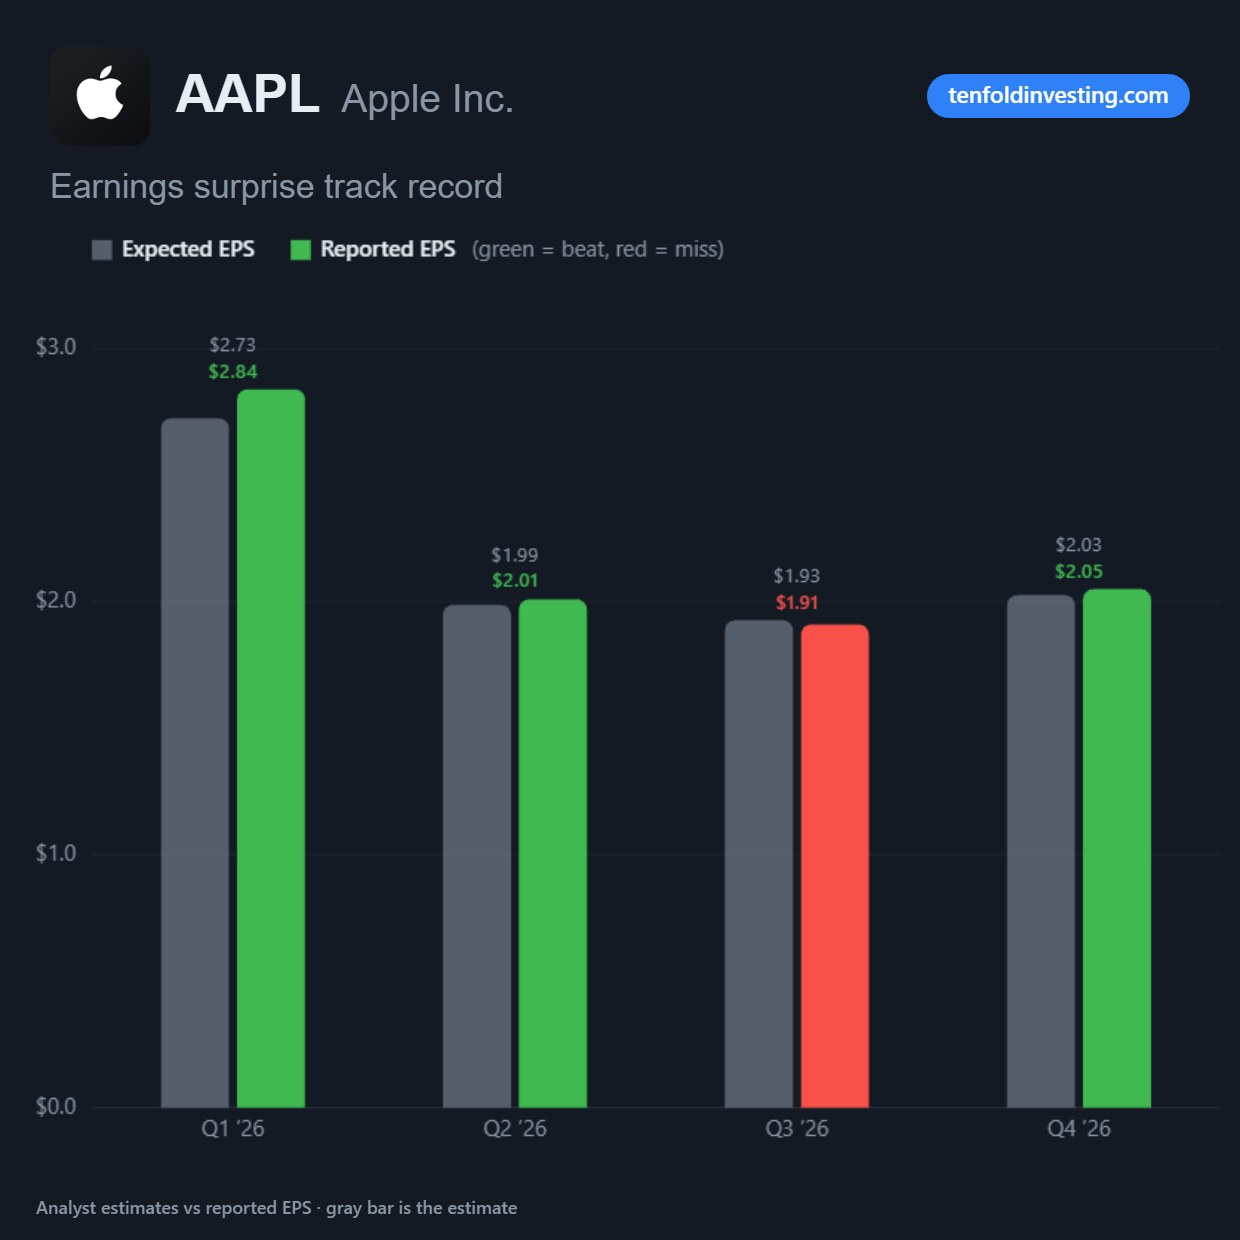
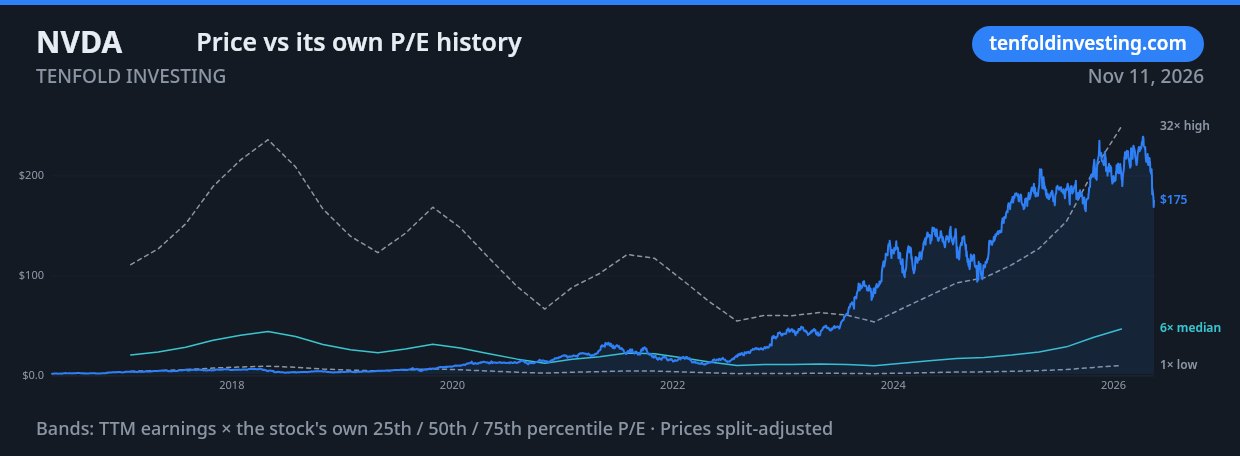
- Price vs its own P/E history, an earnings-surprise track record, and a monthly-returns heatmap going back up to 12 years
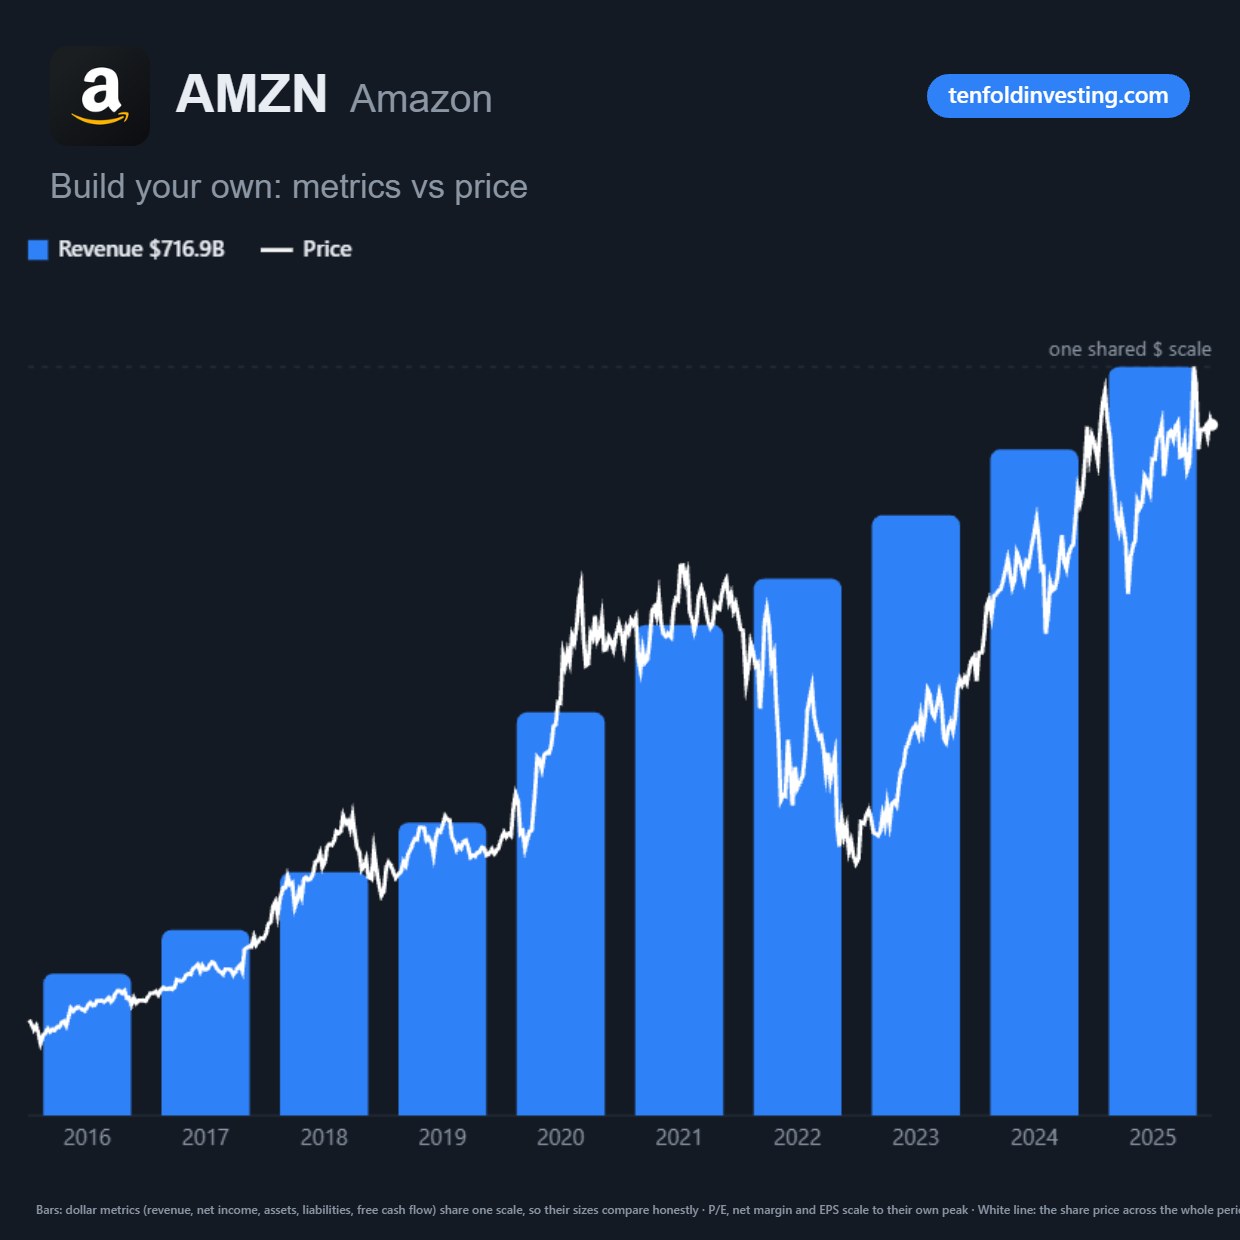
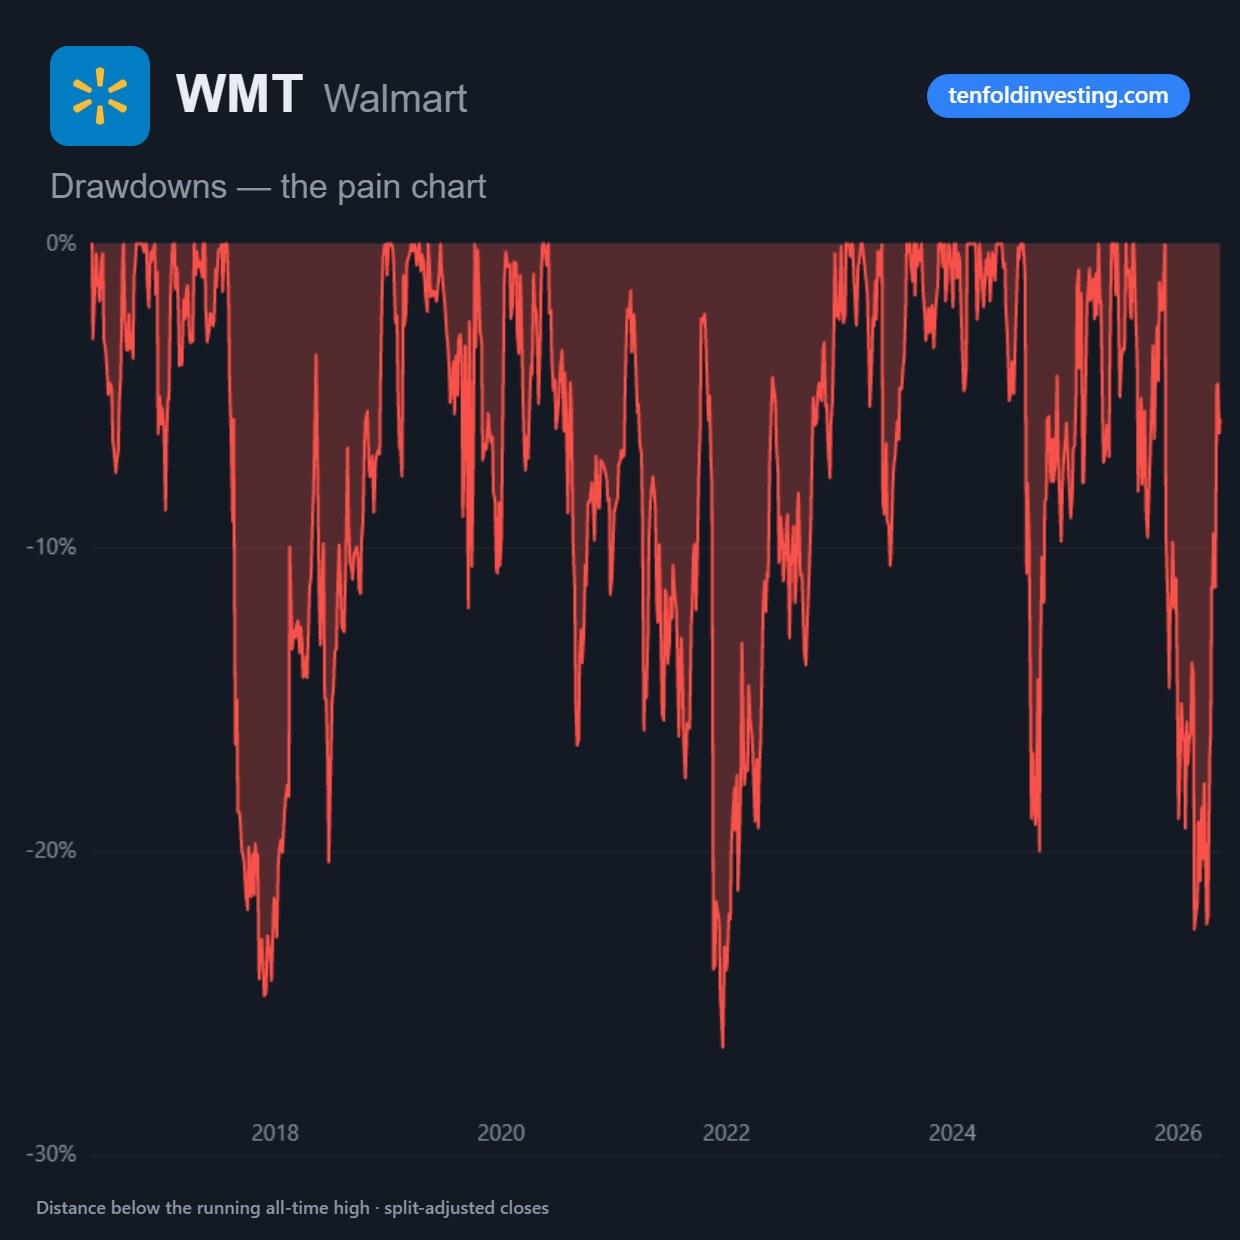
- Margins, free cash flow, drawdowns, share count, dividends and short interest — plus a build-your-own chart with the metrics you pick
- A Magnificent 7 chart that ranks Apple, Microsoft, Alphabet, Amazon, NVIDIA, Meta and Tesla against each other on one metric at a time
- Twelve charts are free; the eleven advanced ones are Premium — and every Premium chart carries a sneak-peek screenshot, so you can see exactly what you'd get before upgrading
- Every chart exports as a clean, branded image, ready to share
Market indicators
Read the market's mood at a glance
Before you dig into any single stock, see what the whole market is doing — how nervous investors are, whether fear or greed is winning, and which corners of the market are moving today.
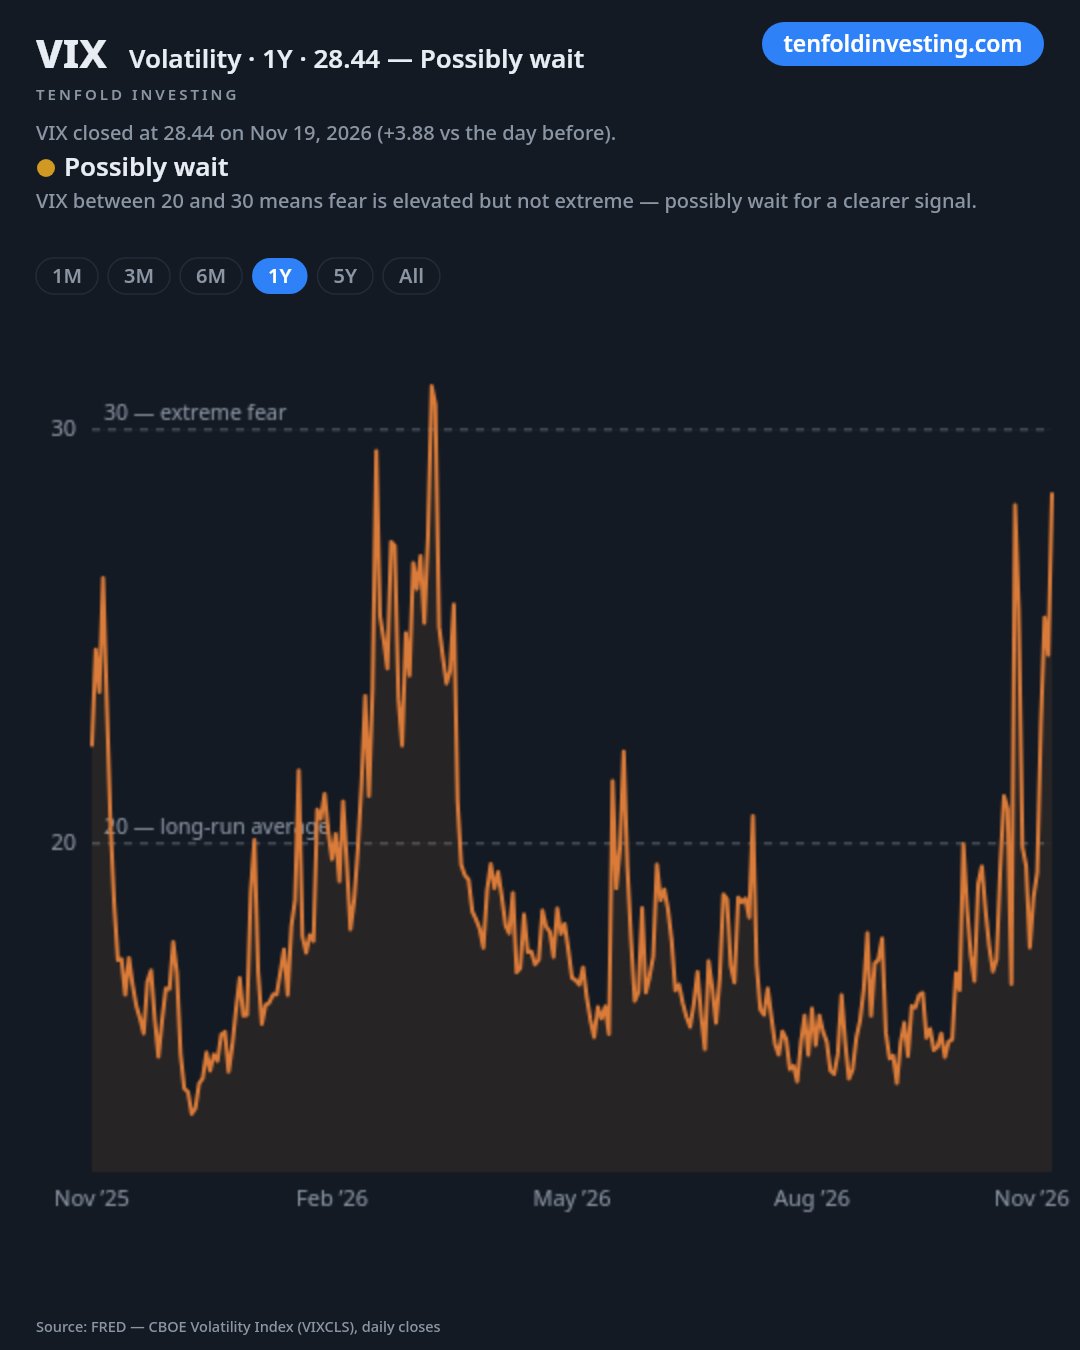
- VIX chart — the market's fear gauge, with the signal that says when fear has usually been a buying moment. Free for everyone
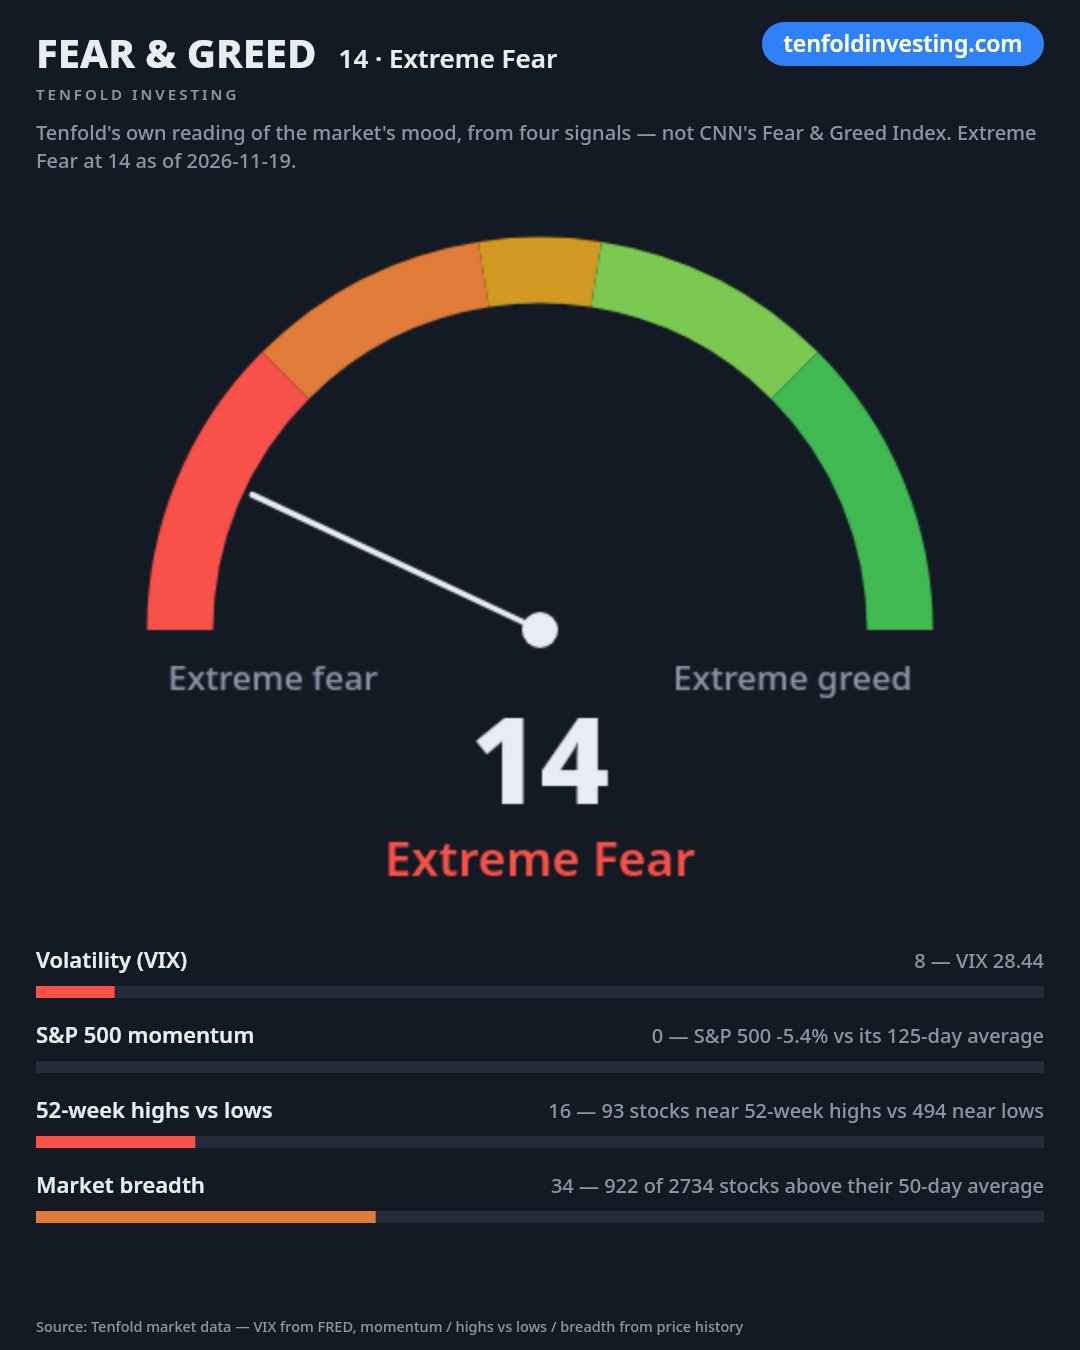
- Fear & Greed gauge — Tenfold's own 0–100 reading of the market's mood, from the VIX, the S&P 500's trend, stocks near their highs and lows, and market breadth. Premium
- Market heatmap — the 600 largest stocks sized by market cap and colored by today's move, live on the Dashboard; tap any tile to open that stock's charts. Free for everyone
Learn — always free
Understand every number you see
The Learn library is free for everyone, forever — no account needed. It's the layer that makes the rest of the site click.
- Plain-English lessons and slideshows, from your first stock to reading a cash-flow statement
- A glossary that explains every metric on the site, plus a ? explainer on the numbers themselves
- A research checklist overview that walks you through a stock the way an analyst would
Why we're different than the other guys
Tenfold is literally the one place where beginner and advanced investors can research stocks in depth and learn how to invest — under the same roof. Most sites make you pick: simple apps that hide the real numbers, or pro terminals that assume you already know everything. We built the place that refuses to choose.
Depth that teaches
Every stock page pairs the serious data — 10 years of SEC financials, the filing library, earnings and analyst consensus — with plain-English explanations of what the numbers mean, so you learn by looking at real companies, not textbook examples.
Practice where you research
Paper trading with $100,000 of virtual cash and earnings contests live right beside the research. Test an idea the moment you have it, with no real money at risk.
Honest numbers, no hype
Financials come straight from SEC filings and quotes refresh all day. Everything is framed for education — never "hot stock" tips or financial advice — and a free version means the door is open to everyone.
See it in action
Real screens from the studio — flip through what members use every day. Each slide is labeled with the section it comes from.
For every level of investor
Whether you're opening your first brokerage account or you've been reading 10-Ks for years, Tenfold meets you where you are — and grows with you.
Just starting out
Plain-English lessons, a glossary that explains every number on the site, and paper trading with virtual cash — learn how stocks work before risking a dollar.
Building confidence
Research any of 2,700+ stocks with guided tools that show every step of the math, set buy-price alerts, and practice projections alongside the community.
The most advanced
Ten years of SEC financials, the filing library with management commentary, DCF and projection models with per-year advanced inputs, and a full-power screener.
Frequently asked questions
What do I get with a subscription?
Premium ($14.99/month, launching soon) unlocks current 20-minute prices, unlimited watchlists, alerts and saved valuation models, tracking for your own holdings, full notifications including 52-week high/low alerts, the complete screener with saved screens, the AI SWOT analysis, the research checklist, insider trading, the Daily brief and the 11 advanced charts (P/E band, drawdowns, build-your-own and more). The free plan keeps research on up to 3 stocks a day (previous-close prices, 10 years of statements, recent SEC filings), paper trading, contests, community features, the Learn library, 12 stock charts and sharing — any chart, model or result can be shared as a branded screenshot, free on both plans. During the closed beta, approved tester accounts get Premium free.
I'm new to investing — is this for me? What if I'm advanced?
Both. Tenfold is built for every level, all the way from beginning investors to the most advanced. New to stocks? Start with the free Learn library, plain-English explainers on every number, and paper trading with $100,000 of virtual cash. Already experienced? Go straight to 10 years of SEC financials, the 10-K/10-Q filing library, DCF and projection models with advanced per-year inputs, and the complete screener. Nothing is dumbed down — the beginner help is layered on top of the full data.
Do I need a brokerage account?
No. The portfolio is paper trading with virtual cash — nothing here connects to a broker or moves real money.
Is this financial advice?
No. Tenfold Investing is for education only. Nothing here is financial advice or a recommendation to buy or sell anything. Always do your own research — or talk to a licensed professional — before investing real money.
Can I cancel anytime?
Yes — once subscriptions open, use "Manage subscription" in the account menu to open the Stripe billing portal and cancel in a couple of clicks; your access continues until the end of your current billing period. During the closed beta nothing is billed, so there is nothing to cancel.
What data sources do you use?
Quotes, profiles and estimates via Finnhub (may be delayed ~20 minutes), financial statements and filings via SEC EDGAR, daily price history via Tiingo and Twelve Data, and monthly-refreshed AI-written company insights. Data may be inaccurate or incomplete — it's a learning aid, not a trading terminal.
· ·
Create your free account with just an email and password: no credit card, no API key to set up. During our closed beta, approved tester accounts get full access — everyone else joins the waitlist for launch day. Coming from another app? Bring your watchlists with you — import the CSV file from your old app or brokerage, or paste your tickers from any app, then drag your lists into your own order. Most people are set up in under a minute.
Welcome back
Create your free account with just an email and password: no credit card, no API key to set up. During our closed beta, approved tester accounts get full access — everyone else joins the waitlist for launch day. Coming from another app? Bring your watchlists with you — import the CSV file from your old app or brokerage, or paste your tickers from any app, then drag your lists into your own order. Most people are set up in under a minute.
Educational purpose only — not financial advice.
Earnings contests
Call whether a company will beat or miss consensus EPS before its earnings report. Virtual points only — just for fun. No prizes, no entry fees, no real money. Educational only — not financial advice.
Leaderboard
Top members by virtual contest points.
Terms of Service
Last updated: October 8, 2026
1. Who can use Tenfold Investing
You must be 18 years or older to create an account or subscribe. One account per person — please don't share your credentials.
2. Educational purpose only — not financial advice
Tenfold Investing is a stock research studio for learning and exploration. Nothing on this site — quotes, screeners, scores, checklists, insights, community votes, projections, or contest picks — is financial advice, and nothing is a personalized recommendation to buy, sell, or hold any security. Always do your own research, or talk to a licensed professional, before investing real money.
3. Subscription & billing
During the closed beta, approved tester accounts are provided Premium access free. Once subscriptions open, Premium will cost $14.99/month, billed recurringly by our payment processor Stripe until you cancel. Cancel anytime from the billing portal ("Manage subscription" in the account menu); your access continues until the end of your current billing period. We may change the price with reasonable notice.
4. Virtual points, votes & predictions
Community votes, shared projections, contest picks and leaderboard points are games with virtual points only. They have no cash value, and there are no prizes, entry fees, or real-money payouts of any kind.
5. Community content
Votes, projections and picks reflect other members' opinions — not advice. There is no free-text posting; please keep the community respectful and don't attempt to harass or mislead others.
6. Market data
Market data may be delayed (~20 minutes), inaccurate, or incomplete. It is provided as a learning aid, not a trading terminal — don't base real trades on it.
7. Your account
You're responsible for activity under your account. Tell us promptly if you suspect unauthorized use.
8. Limitation of liability
The service is provided "as is" without warranties. To the maximum extent allowed by law, we aren't liable for investment decisions or losses, or for indirect or consequential damages. Our total liability is limited to the fees you paid in the 12 months before the claim.
9. Termination
We may suspend or terminate accounts that violate these terms. You can cancel your subscription (and stop using the service) at any time.
10. Our content & code
The Tenfold Investing software, design, text, and data presentation are © 2026 Tenfold Investing, all rights reserved. You may not copy, scrape, frame, republish, or create derivative services from this site or its code, except using the research tools personally as intended. Automated scraping of the site or its data feeds is prohibited.
11. Changes to these terms
We'll post updates here; continued use after changes means you accept them.
12. Contact
Questions about these terms: support@tenfoldinvesting.example
Privacy Policy
Last updated: October 1, 2026
1. What we collect
Account info: your email address and display name. Your data: watchlist symbols, paper-trading and real portfolios (positions, transactions), community votes, shared price projections, contest picks, feature requests, app ratings, and settings. Technical: cached market data and preferences stored in your browser's local storage.
2. How we use it
To provide the service: signing you in, syncing your watchlist/portfolio/settings across devices, running community features, and managing your subscription.
3. Processors
We use Firebase (Google) for authentication and data storage, and Stripe for payment processing. Your card details go directly to Stripe — they never touch our servers.
4. No sale of data
We don't sell your personal data to anyone, and we don't share it with advertisers.
5. Cookies & local storage
We use browser storage for your sign-in session, preferences, cached market data, and a write-through cache of your cloud data so the app stays fast.
6. Data deletion
You can delete your account and all associated data at any time from Settings → Delete my account. This permanently removes your cloud profile, watchlists, portfolios, settings, votes, projections, and picks, and clears this browser's local data.
7. Children's privacy
Tenfold Investing is 18+ only. We don't knowingly collect data from children.
8. Changes
We'll post updates here; continued use after changes means you accept them.
Disclaimers
Last updated: October 1, 2026
1. Educational purpose only — not financial advice
Tenfold Investing is a stock research studio built for learning and exploration. Nothing on this site — quotes, charts, screeners, metrics, scores, checklists, AI insights, community votes, projections, contest picks, or portfolio tools — is financial advice, and nothing is a personalized recommendation to buy, sell, or hold any security. We're not a broker, advisor, or fiduciary. Always do your own research, or talk to a licensed professional, before investing real money.
2. Market data may be delayed or incomplete
Quotes come from Finnhub's free tier and refresh roughly every 20 minutes, so prices you see may lag the live market. Data can also be inaccurate, incomplete, or temporarily unavailable. Financials come from SEC EDGAR filings, which companies sometimes restate. Treat everything here as a learning aid — not a trading terminal — and don't base real trades on it.
3. Community content is opinion, not signal
Bullish/bearish votes and shared price projections reflect what other members think — not what will happen, and not advice. They are not trading signals. Contest picks and leaderboard points are games played with virtual points that have no cash value; there are no prizes, entry fees, or real-money payouts of any kind.
4. Models are simplified hypotheticals
The DCF model, projection playground, compound interest calculator, and portfolio checkups use simplified math and your own assumptions. Small changes in assumptions produce very different answers. They're here to teach you how the math works — not to tell you what a stock is worth.
5. Past performance
Past performance never guarantees future results. Every investment carries risk, including the possible loss of principal.
6. 18+
Tenfold Investing is for adults 18 and older.
Market snapshot
Index ETFs · refreshes automatically
Watchlist glance
Earnings
Most popular stocks this month
What the Tenfold community is watching and holding — ranked by member watchlists, paper & real portfolios, community votes, shared projections and contest picks. Popularity is not a recommendation.
Market news
Research a stock
Stock screener
Scans the full Tenfold universe — about 2,700 US stocks — straight from the live feed. Quotes and fundamentals refresh automatically, and no API key is needed. Tap any ? to learn what a filter means and what a good number looks like.
Quick ranges
Pick a ready-made band for a metric and it fills in that metric's filter boxes in Custom ranges — or skip the bands, open Custom ranges, and type your own numbers in the boxes. Either way, the boxes are what the scan uses.
Custom ranges
Results
| Symbol | Company | Sector | Price | Day % | P/E (TTM) | Div % | Mkt cap $B | % off high |
|---|
Investing tools
Three hands-on models for building intuition: compounding, valuation, and projections. New investors can start with the basics; advanced investors can open the per-year Advanced mode — either way, every step of the math is shown. Hypothetical and for learning only — simplified toys, not investment advice.
Watchlist
Import a list from another app (CSV or paste)
Export your watchlist from your old app as a CSV and pick the file — any format with a Symbol or Ticker column works. Coming from Apple's investing app or others that don't offer a CSV export? Just paste the tickers from your old list below instead — one per line or separated by commas works. Matches are added to the list selected above; anything that can't be matched is reported, never dropped silently.
- On a computer, sign in at finance.yahoo.com — CSV export only works on the desktop site, not the app.
- Click My Portfolio.
- Click the name of the portfolio or watchlist you want to bring over.
- Click the Download icon above the list of stocks.
- Choose Save this portfolio as a CSV — the file downloads as quotes.csv.
- Come back here and pick that file with the file picker below. Done!
Done with this list?
Buy alerts
Sell alerts
Investing, in plain English
Core ideas every stock researcher should know — whether you're a beginning investor buying your first stock or an advanced one sharpening an edge. Educational — not recommendations.
No topic matches that search yet — try a shorter word.
About Tenfold Investing
Tenfold Investing is a stock research studio for learning and exploration, made for investors at every level — from beginning investors buying their first stock to the most advanced. Market data comes from Finnhub (free tier — quotes may be delayed ~20 minutes); daily price history via Stooq where available. Nothing here is financial advice, and past performance never guarantees future results. Always do your own research — or talk to a licensed professional — before investing real money.
Appearance
Choose how Tenfold looks. Your choice is saved to your account, so it follows you across devices.
Market data
Tenfold covers 2,700+ stocks with its own live feed — quotes, fundamentals and news refresh about every 20 minutes, so prices may be delayed. There is nothing to set up and no key to enter: just sign in and research.
Contact
Questions or feedback? Email us at contact@tenfoldinvesting.com — a human reads every message.
Local data
Demo mode: ·
Account
Permanently deletes your account, cloud data (watchlists, portfolios, settings, votes, projections, picks), and this browser's local data. This cannot be undone.
Feedback
Feature ideas & bug reports
What should we build next — or what broke? Send an idea or report a bug; the Tenfold team reads every one. Both are private to the team (other members can't see them).